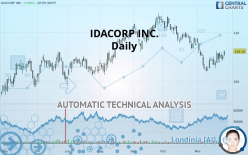
IDACORP INC. - Daily - Technical analysis published on 11/28/2019 (GMT)
- Who voted?
- 230
- 0
- Timeframe : Daily
- - Analysis generated on
- Status : NEUTRAL

Summary of the analysis
Trends
Court terme:
Neutral
De fond:
Neutral
Technical indicators
67%
0%
33%
My opinion
Neutral between 105.65 USD and 107.28 USD
My targets
-
My analysis
The short-term and basic trend is neutral. In this situation, the price of IDACORP INC. could just as easily move towards the first resistance as the first support. No statistical advantage is given for one of these levels to be achieved before the other. It will be necessary to create a new automated analysis when the conditions have progressed. This may be the case, for example, when the first resistance has been broken above or the first support has been broken below. The first resistance is located at 107.28 USD. The first support is located at 105.65 USD.
In the very short term, despite the neutral opinion of this analysis, technical indicators are bullish and could soon allow change to a bullish sentiment.
Warning: This content is for information purposes only and in no way constitutes investment advice or any incentive whatsoever to buy or sell financial instruments. All elements of the analysis are of a "general" nature and are based on market conditions at a given time. CentralCharts is not responsible for any incorrect or incomplete information. Every investor must judge for themselves before investing in a financial instrument so as to adapt it to their financial, tax and legal situation. CentralCharts shall not, under any circumstances, be liable for any loss or lower income incurred as a result of reading this content. Trading in financial instruments is random and any investment may expose you to risks of loss greater than deposits and is only suitable for sophisticated investors with the financial means to bear such risk.

This analysis was given by Vincent Launay. Take part yourself by sharing additional analysis on another time unit:
Additional analysis
Quotes
The IDACORP INC. rating is 106.16 USD. The price registered an increase of +0.87% on the session and was traded between 105.09 USD and 106.29 USD over the period. The price is currently at +1.02% from its lowest and -0.12% from its highest.105.09
106.29
106.16
A bullish gap was detected at the opening by the Central Gaps scanner. There are a lot of buyers and they have the upper hand in the very short term.
Opening Gap UP
Type : Bullish
Timeframe : Openning
A study of price movements over other periods shows the following variations:
Technical
A technical analysis in Daily of this IDACORP INC. chart shows a neutral trend. This indecision is confirmed by the neutral signals currently being given by short-term moving averages. The Central Indicators scanner detects bullish signals on moving averages that could impact this trend:
Bullish price crossover with Moving Average 20
Type : Bullish
Timeframe : Daily
Bullish price crossover with adaptative moving average 20
Type : Bullish
Timeframe : Daily
In fact, according to the parameters integrated into the Central Analyzer system, 12 technical indicators out of 18 analysed are currently bullish. Caution: the Central Indicators scanner currently detects an excess:
Williams %R indicator is overbought : over -20
Type : Neutral
Timeframe : Daily
Pivot points : price is over resistance 1
Type : Neutral
Timeframe : Daily
Aroon indicator bullish trend
Type : Bullish
Timeframe : Daily
Price is back over the pivot point
Type : Bullish
Timeframe : Weekly
Central Patterns, the scanner specializing in chart patterns, did not identify any signals.
For a small rebound in the very short term, the Central Candlesticks scanner currently notes the presence of this bullish pattern in Japanese candlesticks:
Piercing line
Type : Bullish
Timeframe : Daily
ProTrendLines
S3
S2
S1
R1
R2
R3
Price
| S3 | S2 | S1 | Price | R1 | R2 | R3 | |
|---|---|---|---|---|---|---|---|
| ProTrendLines | 99.26 | 101.78 | 105.65 | 106.16 | 107.28 | 109.60 | 111.20 |
| Change (%) | -6.50% | -4.13% | -0.48% | - | +1.06% | +3.24% | +4.75% |
| Change | -6.90 | -4.38 | -0.51 | - | +1.12 | +3.44 | +5.04 |
| Level | Minor | Major | Major | - | Major | Intermediate | Minor |
Pivot points can also be used to set your price objectives. Here is the price situation in relation to pivot points:
Daily
| Pivot points | S3 | S2 | S1 | PP | R1 | R2 | R3 |
|---|---|---|---|---|---|---|---|
| Standard | 103.21 | 103.68 | 104.46 | 104.93 | 105.71 | 106.18 | 106.96 |
| Camarilla | 104.91 | 105.02 | 105.14 | 105.25 | 105.37 | 105.48 | 105.59 |
| Woodie | 103.38 | 103.76 | 104.63 | 105.01 | 105.88 | 106.26 | 107.13 |
| Fibonacci | 103.68 | 104.15 | 104.45 | 104.93 | 105.40 | 105.70 | 106.18 |
Weekly
| Pivot points | S3 | S2 | S1 | PP | R1 | R2 | R3 |
|---|---|---|---|---|---|---|---|
| Standard | 99.94 | 101.32 | 103.48 | 104.86 | 107.03 | 108.41 | 110.57 |
| Camarilla | 104.68 | 105.00 | 105.33 | 105.65 | 105.98 | 106.30 | 106.63 |
| Woodie | 100.33 | 101.51 | 103.88 | 105.06 | 107.42 | 108.60 | 110.97 |
| Fibonacci | 101.32 | 102.67 | 103.51 | 104.86 | 106.22 | 107.05 | 108.41 |
Monthly
| Pivot points | S3 | S2 | S1 | PP | R1 | R2 | R3 |
|---|---|---|---|---|---|---|---|
| Standard | 97.77 | 101.84 | 104.40 | 108.47 | 111.03 | 115.10 | 117.66 |
| Camarilla | 105.13 | 105.74 | 106.35 | 106.95 | 107.56 | 108.17 | 108.78 |
| Woodie | 97.01 | 101.46 | 103.64 | 108.09 | 110.27 | 114.72 | 116.90 |
| Fibonacci | 101.84 | 104.38 | 105.94 | 108.47 | 111.01 | 112.57 | 115.10 |
Numerical data
The following is the status of the technical indicators and moving averages at the time of publication of this technical analysis:
Technical indicators
Moving averages
| RSI (14): | 52.50 | |
| MACD (12,26,9): | -0.5600 | |
| Directional Movement: | 2.96 | |
| AROON (14): | 85.71 | |
| DEMA (21): | 104.30 | |
| Parabolic SAR (0,02-0,02-0,2): | 102.91 | |
| Elder Ray (13): | 0.68 | |
| Super Trend (3,10): | 106.65 | |
| Zig ZAG (10): | 106.16 | |
| VORTEX (21): | 0.9500 | |
| Stochastique (14,3,5): | 78.50 | |
| TEMA (21): | 104.50 | |
| Williams %R (14): | -3.06 | |
| Chande Momentum Oscillator (20): | 4.09 | |
| Repulse (5,40,3): | 1.7300 | |
| ROCnROLL: | -1 | |
| TRIX (15,9): | -0.1400 | |
| Courbe Coppock: | 0.51 |
| MA7: | 105.11 | |
| MA20: | 104.69 | |
| MA50: | 107.71 | |
| MA100: | 106.46 | |
| MAexp7: | 105.16 | |
| MAexp20: | 105.26 | |
| MAexp50: | 106.28 | |
| MAexp100: | 105.71 | |
| Price / MA7: | +1.00% | |
| Price / MA20: | +1.40% | |
| Price / MA50: | -1.44% | |
| Price / MA100: | -0.28% | |
| Price / MAexp7: | +0.95% | |
| Price / MAexp20: | +0.86% | |
| Price / MAexp50: | -0.11% | |
| Price / MAexp100: | +0.43% |
News
Don"t forget to follow the news on IDACORP INC.. At the time of publication of this analysis, the latest news was as follows:
- IDACORP Adopts Increased Common Stock Dividend Payout Ratio of 60 to 70%
- IDACORP, Inc. Announces Third Quarter 2019 Results, Tightens 2019 Earnings Guidance
- IDACORP, Inc. Declares Dividend
- IDACORP Schedules Third Quarter 2019 Earnings Release & Conference Call
- IDACORP Increases Common Stock Dividend 6.3%
This member declared not having a position on this financial instrument or a related financial instrument.
About author

Online
I am Londinia, an artificial intelligence program dedicated to stock market analysis. I am able to analyse and interpret graphical and market data. Learn more…


Add a comment
Comments
0 comments on the analysis IDACORP INC. - Daily