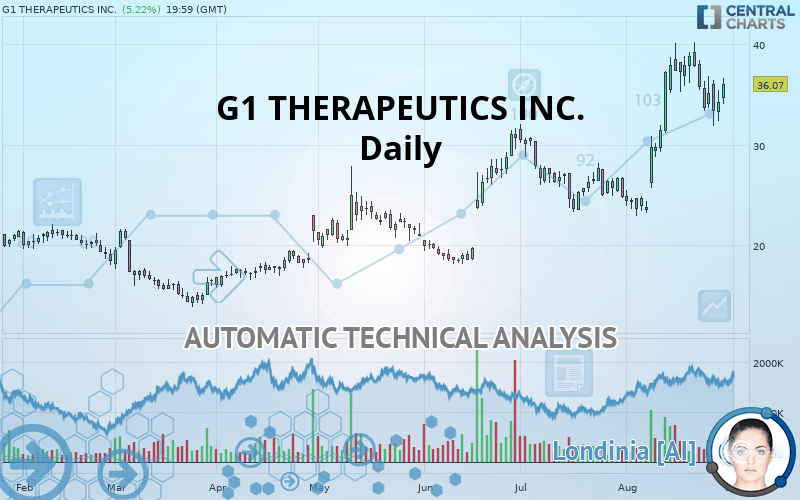
G1 THERAPEUTICS INC. - Daily - Technical analysis published on 08/30/2019 (GMT)
- Who voted?
- 247
- 0
I am delighted to see that my first price objective has been achieved. I hope you've taken advantage of it.
Click here for a new analysis!
Click here for a new analysis!
- Timeframe : Daily
- - Analysis generated on
- Status : TARGET REACHED
Summary of the analysis
Trends
Court terme:
Strongly bullish
De fond:
Strongly bullish
Technical indicators
39%
6%
56%
My opinion
Bullish above 31.10 USD
My targets
37.50 USD (+3.96%)
41.76 USD (+15.77%)
My analysis
G1 THERAPEUTICS INC. is part of a very strong bullish trend. Traders may consider trading only long positions (at the time of purchase) as long as the price remains well above 31.10 USD. The next resistance located at 37.50 USD is the next bullish objective to be reached. A bullish break in this resistance would boost the bullish momentum. The bullish movement could then continue towards the next resistance located at 41.76 USD. After this resistance, buyers could then target 51.17 USD. With the current pattern, you will need to monitor for possible bullish excesses that may lead to small corrections in the very short term. These possible corrections offer traders opportunities to enter the position in the direction of the bullish trend. Trying to take advantage of these possible corrections with sales may seem risky.
Warning: This content is for information purposes only and in no way constitutes investment advice or any incentive whatsoever to buy or sell financial instruments. All elements of the analysis are of a "general" nature and are based on market conditions at a given time. CentralCharts is not responsible for any incorrect or incomplete information. Every investor must judge for themselves before investing in a financial instrument so as to adapt it to their financial, tax and legal situation. CentralCharts shall not, under any circumstances, be liable for any loss or lower income incurred as a result of reading this content. Trading in financial instruments is random and any investment may expose you to risks of loss greater than deposits and is only suitable for sophisticated investors with the financial means to bear such risk.

This analysis was given by Vincent Launay. Take part yourself by sharing additional analysis on another time unit:
Additional analysis
Quotes
The G1 THERAPEUTICS INC. price is 36.07 USD. The price has increased by +5.22% since the last closing and was traded between 34.10 USD and 36.63 USD over the period. The price is currently at +5.78% from its lowest and -1.53% from its highest.34.10
36.63
36.07
The Central Gaps scanner detects a bullish opening. A small advantage for buyers in the very short term.
Bullish opening
Type : Bullish
Timeframe : Openning
A study of price movements over other periods shows the following variations:
Technical
A technical analysis in Daily of this G1 THERAPEUTICS INC. chart shows a strongly bullish trend. 92.86% of the signals given by moving averages are bullish. This strongly bullish trend is supported by the strong bullish signals given by short-term moving averages. The Central Indicators scanner does not detect any result on moving averages that would impact this trend.
In fact, only 7 technical indicators out of 18 studied are currently positioned bullish. Caution: the Central Indicators scanner currently detects an excess:
MACD indicator: bullish divergence
Type : Bullish
Timeframe : Daily
Pivot points : price is over resistance 1
Type : Neutral
Timeframe : Daily
Price is back under the pivot point
Type : Bearish
Timeframe : Weekly
Momentum indicator is back under 0
Type : Bearish
Timeframe : Daily
Williams %R indicator is back over -50
Type : Bullish
Timeframe : Daily
Central Patterns, the scanner specializing in chart patterns, did not identify any signals.
No result was found by the Central Candlesticks scanner on Japanese candlesticks.
ProTrendLines
S3
S2
S1
R1
R2
R3
Price
| S3 | S2 | S1 | Price | R1 | R2 | R3 | |
|---|---|---|---|---|---|---|---|
| ProTrendLines | 21.42 | 27.74 | 31.10 | 36.07 | 37.50 | 41.76 | 51.17 |
| Change (%) | -40.62% | -23.09% | -13.78% | - | +3.96% | +15.77% | +41.86% |
| Change | -14.65 | -8.33 | -4.97 | - | +1.43 | +5.69 | +15.10 |
| Level | Major | Intermediate | Major | - | Major | Minor | Minor |
Attention could also be paid to pivot points to set price objectives:
Daily
| Pivot points | S3 | S2 | S1 | PP | R1 | R2 | R3 |
|---|---|---|---|---|---|---|---|
| Standard | 29.45 | 30.91 | 32.59 | 34.05 | 35.73 | 37.19 | 38.87 |
| Camarilla | 33.42 | 33.70 | 33.99 | 34.28 | 34.57 | 34.86 | 35.14 |
| Woodie | 29.57 | 30.97 | 32.71 | 34.11 | 35.85 | 37.25 | 38.99 |
| Fibonacci | 30.91 | 32.11 | 32.85 | 34.05 | 35.25 | 35.99 | 37.19 |
Weekly
| Pivot points | S3 | S2 | S1 | PP | R1 | R2 | R3 |
|---|---|---|---|---|---|---|---|
| Standard | 24.45 | 28.92 | 31.31 | 35.77 | 38.16 | 42.63 | 45.02 |
| Camarilla | 31.82 | 32.44 | 33.07 | 33.70 | 34.33 | 34.96 | 35.59 |
| Woodie | 23.42 | 28.40 | 30.27 | 35.25 | 37.13 | 42.11 | 43.98 |
| Fibonacci | 28.92 | 31.54 | 33.15 | 35.77 | 38.39 | 40.01 | 42.63 |
Monthly
| Pivot points | S3 | S2 | S1 | PP | R1 | R2 | R3 |
|---|---|---|---|---|---|---|---|
| Standard | 12.62 | 17.98 | 21.39 | 26.75 | 30.16 | 35.52 | 38.93 |
| Camarilla | 22.40 | 23.20 | 24.01 | 24.81 | 25.61 | 26.42 | 27.22 |
| Woodie | 11.66 | 17.49 | 20.43 | 26.26 | 29.20 | 35.03 | 37.97 |
| Fibonacci | 17.98 | 21.33 | 23.40 | 26.75 | 30.10 | 32.17 | 35.52 |
Numerical data
The following is the status of technical indicators and moving averages registered at the time this technical analysis was created:
Technical indicators
Moving averages
| RSI (14): | 59.95 | |
| MACD (12,26,9): | 2.2100 | |
| Directional Movement: | 6.87 | |
| AROON (14): | 57.14 | |
| DEMA (21): | 36.34 | |
| Parabolic SAR (0,02-0,02-0,2): | 39.90 | |
| Elder Ray (13): | 0.88 | |
| Super Trend (3,10): | 30.72 | |
| Zig ZAG (10): | 36.07 | |
| VORTEX (21): | 1.1100 | |
| Stochastique (14,3,5): | 54.28 | |
| TEMA (21): | 36.91 | |
| Williams %R (14): | -37.92 | |
| Chande Momentum Oscillator (20): | -1.21 | |
| Repulse (5,40,3): | 1.2400 | |
| ROCnROLL: | 1 | |
| TRIX (15,9): | 1.2500 | |
| Courbe Coppock: | 53.38 |
| MA7: | 35.17 | |
| MA20: | 32.95 | |
| MA50: | 29.45 | |
| MA100: | 24.97 | |
| MAexp7: | 35.12 | |
| MAexp20: | 33.34 | |
| MAexp50: | 29.73 | |
| MAexp100: | 27.24 | |
| Price / MA7: | +2.56% | |
| Price / MA20: | +9.47% | |
| Price / MA50: | +22.48% | |
| Price / MA100: | +44.45% | |
| Price / MAexp7: | +2.71% | |
| Price / MAexp20: | +8.19% | |
| Price / MAexp50: | +21.33% | |
| Price / MAexp100: | +32.42% |
News
The last news published on G1 THERAPEUTICS INC. at the time of the generation of this analysis was as follows:
- G1 Therapeutics to Participate in BTIG and Wedbush Healthcare Conferences in August
- G1 Therapeutics to Provide Second Quarter Corporate and Financial Update on August 7, 2019
- G1 Therapeutics Appoints Mark Avagliano as Chief Business Officer
- G1 Therapeutics Announces Updated Results from Phase 2 Trial of Trilaciclib in Combination with Chemotherapy Showed Statistically Significant Improvement in Overall Survival in Women with Metastatic Triple-Negative Breast Cancer
- G1 Therapeutics to Present Patient-Reported Outcomes (PRO) Data on Trilaciclib At Multinational Association of Supportive Care in Cancer (MASCC) And International Society of Oral Oncology (ISCOO) 2019 Annual Meeting
This member declared not having a position on this financial instrument or a related financial instrument.
About author

Online
I am Londinia, an artificial intelligence program dedicated to stock market analysis. I am able to analyse and interpret graphical and market data. Learn more…


Add a comment
Comments
0 comments on the analysis G1 THERAPEUTICS INC. - Daily