INDITEX - Daily - Technical analysis published on 11/19/2019 (GMT)
- Who voted?
- 304
- 0
Click here for a new analysis!
- Timeframe : Daily
- - Analysis generated on
- Status : TARGET REACHED

Summary of the analysis

Additional analysis
Quotes
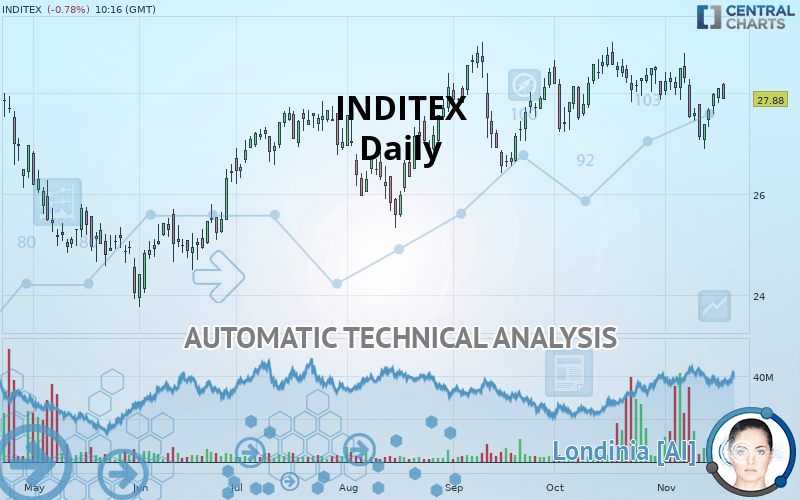
INDITEX rating 27.88 EUR. The price registered a decrease of -0.78% on the session with the lowest point at 27.88 EUR and the highest point at 28.19 EUR. The deviation from the price is 0% for the low point and -1.10% for the high point.The Central Gaps scanner detects a bullish gap which is a sign that buyers have taken the lead in the very short term.
Opening Gap UP
Type : Bullish
Timeframe : Openning
A study of price movements over other periods shows the following variations:
Near a new LOW record (1st january)
Type : Bearish
Timeframe : Weekly
Abnormal volumes on INDITEX were detected by the Central Volumes scanner:
Abnormal volumes
Timeframe : 20 days
Technical
Technical analysis of INDITEX in Daily shows a strongly overall bullish trend. The signals given by the moving averages are 92.86% bullish. This strong bullish trend is confirmed by the strong signals currently being given by short-term moving averages. The Central Indicators market scanner is currently detecting several bullish signals that could impact this trend:
Bullish trend reversal : Moving Average 20
Type : Bullish
Timeframe : Daily
Bullish price crossover with Moving Average 20
Type : Bullish
Timeframe : Daily
Bullish price crossover with Moving Average 50
Type : Bullish
Timeframe : Daily
Bullish price crossover with Moving Average 100
Type : Bullish
Timeframe : Daily
Bullish price crossover with adaptative moving average 20
Type : Bullish
Timeframe : Daily
Bullish price crossover with adaptative moving average 50
Type : Bullish
Timeframe : Daily
Bullish price crossover with adaptative moving average 100
Type : Bullish
Timeframe : Daily
On the 18 technical indicators analysed, 9 are bullish, 4 are neutral and 5 are bearish. But beware of excesses. The Central Indicators scanner currently detects this:
Previous candle closed under Bollinger bands
Type : Neutral
Timeframe : Daily
Williams %R indicator is overbought : over -20
Type : Neutral
Timeframe : Daily
Pivot points : price is over resistance 3
Type : Neutral
Timeframe : Weekly
RSI indicator is back over 50
Type : Bullish
Timeframe : Daily
Parabolic SAR indicator bullish reversal
Type : Bullish
Timeframe : Daily
Ichimoku : price is over the cloud
Type : Bullish
Timeframe : Daily
SuperTrend indicator bullish reversal
Type : Bullish
Timeframe : Daily
Price is back over the pivot point
Type : Bullish
Timeframe : Daily
Williams %R indicator is back over -50
Type : Bullish
Timeframe : Daily
Central Patterns, the market scanner focusing on chart patterns, resistances and supports found these results:
Near resistance of channel
Type : Bearish
Timeframe : Daily
Horizontal resistance is broken
Type : Bullish
Timeframe : Daily
No result was found by the Central Candlesticks scanner on Japanese candlesticks.
| S3 | S2 | S1 | Price | R1 | R2 | R3 | |
|---|---|---|---|---|---|---|---|
| ProTrendLines | 25.59 | 26.56 | 27.12 | 27.88 | 27.99 | 28.76 | 29.99 |
| Change (%) | -8.21% | -4.73% | -2.73% | - | +0.39% | +3.16% | +7.57% |
| Change | -2.29 | -1.32 | -0.76 | - | +0.11 | +0.88 | +2.11 |
| Level | Minor | Minor | Intermediate | - | Major | Major | Intermediate |
Pivot points can also be used to set your price objectives. Here is the price situation in relation to pivot points:
| Pivot points | S3 | S2 | S1 | PP | R1 | R2 | R3 |
|---|---|---|---|---|---|---|---|
| Standard | 27.58 | 27.69 | 27.89 | 28.00 | 28.20 | 28.31 | 28.51 |
| Camarilla | 28.02 | 28.04 | 28.07 | 28.10 | 28.13 | 28.16 | 28.19 |
| Woodie | 27.64 | 27.71 | 27.95 | 28.02 | 28.26 | 28.33 | 28.57 |
| Fibonacci | 27.69 | 27.81 | 27.88 | 28.00 | 28.12 | 28.19 | 28.31 |
| Pivot points | S3 | S2 | S1 | PP | R1 | R2 | R3 |
|---|---|---|---|---|---|---|---|
| Standard | 21.20 | 21.32 | 21.50 | 21.62 | 21.81 | 21.93 | 22.11 |
| Camarilla | 21.60 | 21.63 | 21.66 | 21.69 | 21.71 | 21.74 | 21.77 |
| Woodie | 21.23 | 21.34 | 21.53 | 21.64 | 21.84 | 21.94 | 22.14 |
| Fibonacci | 21.32 | 21.44 | 21.51 | 21.62 | 21.74 | 21.81 | 21.93 |
| Pivot points | S3 | S2 | S1 | PP | R1 | R2 | R3 |
|---|---|---|---|---|---|---|---|
| Standard | 25.23 | 26.02 | 26.98 | 27.77 | 28.74 | 29.52 | 30.49 |
| Camarilla | 27.47 | 27.63 | 27.79 | 27.95 | 28.11 | 28.27 | 28.43 |
| Woodie | 25.32 | 26.06 | 27.07 | 27.81 | 28.83 | 29.57 | 30.58 |
| Fibonacci | 26.02 | 26.68 | 27.10 | 27.77 | 28.44 | 28.85 | 29.52 |
Numerical data
The following is the status of the technical indicators and moving averages at the time of publication of this technical analysis:
| RSI (14): | 51.65 | |
| MACD (12,26,9): | -0.1000 | |
| Directional Movement: | 2.50 | |
| AROON (14): | -50.00 | |
| DEMA (21): | 27.52 | |
| Parabolic SAR (0,02-0,02-0,2): | 24.60 | |
| Elder Ray (13): | 0.50 | |
| Super Trend (3,10): | 25.25 | |
| Zig ZAG (10): | 27.89 | |
| VORTEX (21): | 0.9500 | |
| Stochastique (14,3,5): | 56.33 | |
| TEMA (21): | 27.31 | |
| Williams %R (14): | -21.48 | |
| Chande Momentum Oscillator (20): | -0.32 | |
| Repulse (5,40,3): | -0.1100 | |
| ROCnROLL: | 1 | |
| TRIX (15,9): | -0.0100 | |
| Courbe Coppock: | 4.54 |
| MA7: | 27.29 | |
| MA20: | 27.75 | |
| MA50: | 27.53 | |
| MA100: | 27.15 | |
| MAexp7: | 27.44 | |
| MAexp20: | 27.61 | |
| MAexp50: | 27.51 | |
| MAexp100: | 27.07 | |
| Price / MA7: | +2.16% | |
| Price / MA20: | +0.47% | |
| Price / MA50: | +1.27% | |
| Price / MA100: | +2.69% | |
| Price / MAexp7: | +1.60% | |
| Price / MAexp20: | +0.98% | |
| Price / MAexp50: | +1.34% | |
| Price / MAexp100: | +2.99% |
News
The latest news and videos published on INDITEX at the time of the analysis were as follows:
-
 UK GDP latest, Poland's Duda visits Washington, Inditex results
-
Key Brexit votes, energy leaders' shale focus, Inditex reports
-
Brexit deal vote, ECB meeting, Inditex results
-
Inditex
About author

Online


Add a comment
Comments
0 comments on the analysis INDITEX - Daily