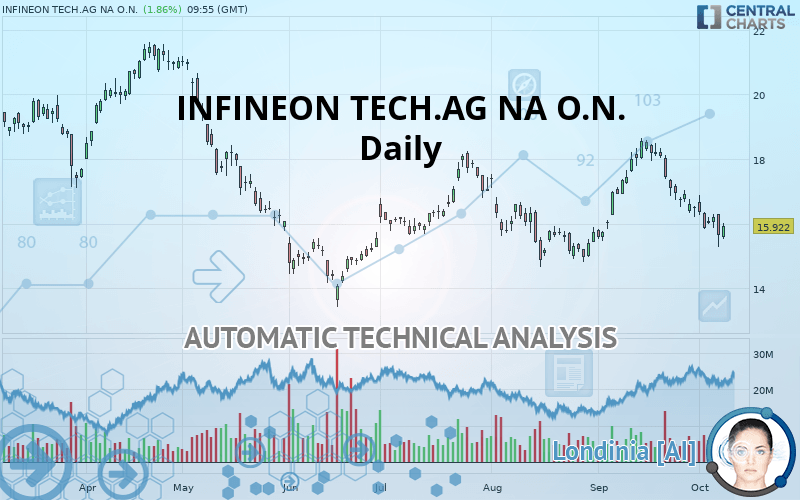
INFINEON TECH.AG NA O.N. - Daily - Technical analysis published on 10/09/2019 (GMT)
- Who voted?
- 232
- 0
Click here for a new analysis!
- Timeframe : Daily
- - Analysis generated on
- Status : INVALID
Summary of the analysis

Additional analysis
Quotes
INFINEON TECH.AG NA O.N. rating 15.922 EUR. The price has increased by +1.86% since the last closing and was traded between 15.522 EUR and 16.004 EUR over the period. The price is currently at +2.58% from its lowest and -0.51% from its highest.A bearish opening was detected by the Central Gaps scanner. Sellers are trying to impose a bearish trend in the very short term.
Bearish opening
Type : Bearish
Timeframe : Openning
Here is a more detailed summary of the historical variations registered by INFINEON TECH.AG NA O.N.:
Near a new LOW record (1 month)
Type : Bearish
Timeframe : Weekly
Technical
Technical analysis of this Daily chart of INFINEON TECH.AG NA O.N. indicates that the overall trend is strongly bearish. 82.14% of the signals given by moving averages are bearish. This strongly bearish trend is supported by the strong bearish signals given by short-term moving averages. The Central Indicators scanner does not detect any result on moving averages that would impact this trend.
Technical indicators are bearish. There is still some doubt about the decline in the price.
But beware of excesses. The Central Indicators scanner currently detects this:
CCI indicator is oversold : under -100
Type : Neutral
Timeframe : Daily
Williams %R indicator is oversold : under -80
Type : Neutral
Timeframe : Daily
Ichimoku : price is under the cloud
Type : Bearish
Timeframe : Daily
Price is back under the pivot point
Type : Bearish
Timeframe : Daily
Price is back under the pivot point
Type : Bearish
Timeframe : Weekly
An analysis of the price chart with the Central Patterns scanner (detector of chart patterns and resistances and supports) shows several results that can have an impact on the price change:
Near horizontal support
Type : Bullish
Timeframe : Daily
Support of channel is broken
Type : Bearish
Timeframe : Daily
Support of triangle is broken
Type : Bearish
Timeframe : Daily
Central Candlesticks, the scanner specialised in Japanese candlesticks, detects a bearish signal that could support the hypothesis of a small drop in the very short term:
Bearish engulfing lines
Type : Bearish
Timeframe : Daily
| S3 | S2 | S1 | Price | R1 | R2 | R3 | |
|---|---|---|---|---|---|---|---|
| ProTrendLines | 13.440 | 14.070 | 14.878 | 15.922 | 16.140 | 18.102 | 20.166 |
| Change (%) | -15.59% | -11.63% | -6.56% | - | +1.37% | +13.69% | +26.65% |
| Change | -2.482 | -1.852 | -1.044 | - | +0.218 | +2.180 | +4.244 |
| Level | Intermediate | Minor | Major | - | Major | Major | Intermediate |
To determine price objectives, it is also possible to use the pivot points. Here is the price position in relation to pivot points:
| Pivot points | S3 | S2 | S1 | PP | R1 | R2 | R3 |
|---|---|---|---|---|---|---|---|
| Standard | 14.143 | 14.711 | 15.171 | 15.739 | 16.199 | 16.767 | 17.227 |
| Camarilla | 15.349 | 15.444 | 15.538 | 15.632 | 15.726 | 15.821 | 15.915 |
| Woodie | 14.090 | 14.684 | 15.118 | 15.712 | 16.146 | 16.740 | 17.174 |
| Fibonacci | 14.711 | 15.103 | 15.346 | 15.739 | 16.131 | 16.374 | 16.767 |
| Pivot points | S3 | S2 | S1 | PP | R1 | R2 | R3 |
|---|---|---|---|---|---|---|---|
| Standard | 14.609 | 15.223 | 15.649 | 16.263 | 16.689 | 17.303 | 17.729 |
| Camarilla | 15.788 | 15.883 | 15.979 | 16.074 | 16.169 | 16.265 | 16.360 |
| Woodie | 14.514 | 15.176 | 15.554 | 16.216 | 16.594 | 17.256 | 17.634 |
| Fibonacci | 15.223 | 15.621 | 15.866 | 16.263 | 16.661 | 16.906 | 17.303 |
| Pivot points | S3 | S2 | S1 | PP | R1 | R2 | R3 |
|---|---|---|---|---|---|---|---|
| Standard | 11.937 | 13.705 | 15.109 | 16.877 | 18.281 | 20.049 | 21.453 |
| Camarilla | 15.640 | 15.931 | 16.221 | 16.512 | 16.803 | 17.094 | 17.384 |
| Woodie | 11.754 | 13.614 | 14.926 | 16.786 | 18.098 | 19.958 | 21.270 |
| Fibonacci | 13.705 | 14.917 | 15.666 | 16.877 | 18.089 | 18.838 | 20.049 |
Numerical data
The following is the status of technical indicators and moving averages registered at the time this technical analysis was created:
| RSI (14): | 40.83 | |
| MACD (12,26,9): | -0.2220 | |
| Directional Movement: | -12.980 | |
| AROON (14): | -92.857 | |
| DEMA (21): | 16.389 | |
| Parabolic SAR (0,02-0,02-0,2): | 16.672 | |
| Elder Ray (13): | -0.659 | |
| Super Trend (3,10): | 17.344 | |
| Zig ZAG (10): | 15.964 | |
| VORTEX (21): | 0.8100 | |
| Stochastique (14,3,5): | 15.61 | |
| TEMA (21): | 16.040 | |
| Williams %R (14): | -78.11 | |
| Chande Momentum Oscillator (20): | -1.486 | |
| Repulse (5,40,3): | -0.2170 | |
| ROCnROLL: | 2 | |
| TRIX (15,9): | 0.0210 | |
| Courbe Coppock: | 20.79 |
| MA7: | 16.079 | |
| MA20: | 17.095 | |
| MA50: | 16.434 | |
| MA100: | 16.189 | |
| MAexp7: | 16.120 | |
| MAexp20: | 16.560 | |
| MAexp50: | 16.593 | |
| MAexp100: | 16.795 | |
| Price / MA7: | -0.98% | |
| Price / MA20: | -6.86% | |
| Price / MA50: | -3.12% | |
| Price / MA100: | -1.65% | |
| Price / MAexp7: | -1.23% | |
| Price / MAexp20: | -3.85% | |
| Price / MAexp50: | -4.04% | |
| Price / MAexp100: | -5.20% |
News
The last news published on INFINEON TECH.AG NA O.N. at the time of the generation of this analysis was as follows:
- Lanner Partners with Infineon to Provide Trusted Network and IoT Computing Platforms
- DGAP-Adhoc: Infineon Technologies AG: Infineon Technologies AG starting bookbuilding process for inaugural dual-tranche EUR perpetual hybrid bond
- DGAP-News: Infineon Technologies AG: INFINEON PERFORMS WELL IN CHALLENGING MARKET ENVIRONMENT - REVENUE AND EARNINGS MEET EXPECTATIONS
- Infineon and FuturePlay to jointly strengthen start-up ecosystem in South Korea
- DGAP-Adhoc: Infineon Technologies AG: Infineon determines the placement price for the new shares
About author

Online


Add a comment
Comments
0 comments on the analysis INFINEON TECH.AG NA O.N. - Daily