INGENICO GROUP - Daily - Technical analysis published on 11/07/2019 (GMT)
- Who voted?
- 292
- 0
I am pleased to note that the threshold for invalidation has been maintained for 20 Candlesticks.
Click here for a new analysis!
Click here for a new analysis!
- Timeframe : Daily
- - Analysis generated on
- Status : LEVEL MAINTAINED

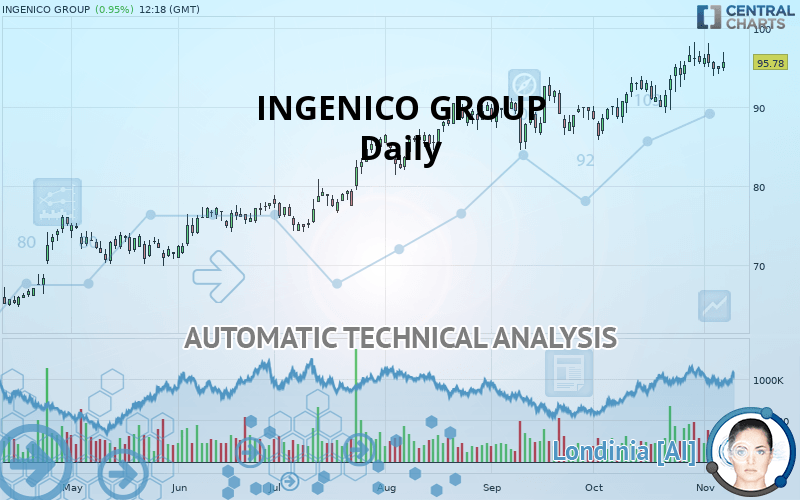
INGENICO GROUP Chart
Summary of the analysis
Trends
Court terme:
Strongly bullish
De fond:
Strongly bullish
Technical indicators
44%
6%
50%
My opinion
Bullish above 93.70 EUR
My targets
110.15 EUR (+15.00%)
127.60 EUR (+33.22%)
My analysis
INGENICO GROUP is part of a very strong bullish trend. Traders may consider trading only long positions (at the time of purchase) as long as the price remains well above 93.70 EUR. The next resistance located at 110.15 EUR is the next bullish objective to be reached. A bullish break in this resistance would boost the bullish momentum. The bullish movement could then continue towards the next resistance located at 127.60 EUR. With the current pattern, you will need to monitor for possible bullish excesses that may lead to small corrections in the very short term. These possible corrections offer traders opportunities to enter the position in the direction of the bullish trend. Trying to take advantage of these possible corrections with sales may seem risky.
In the very short term, the general bullish sentiment is confirmed by technical indicators. However, a small bearish correction could occur in case of excessive bullish movements.
FORCE
0
10
7.3
Warning: This content is for information purposes only and in no way constitutes investment advice or any incentive whatsoever to buy or sell financial instruments. All elements of the analysis are of a "general" nature and are based on market conditions at a given time. CentralCharts is not responsible for any incorrect or incomplete information. Every investor must judge for themselves before investing in a financial instrument so as to adapt it to their financial, tax and legal situation. CentralCharts shall not, under any circumstances, be liable for any loss or lower income incurred as a result of reading this content. Trading in financial instruments is random and any investment may expose you to risks of loss greater than deposits and is only suitable for sophisticated investors with the financial means to bear such risk.
This analysis was given by Vincent Launay.
Additional analysis
Quotes
The INGENICO GROUP rating is 95.78 EUR. The price has increased by +0.95% since the last closing with the lowest point at 94.54 EUR and the highest point at 96.96 EUR. The deviation from the price is +1.31% for the low point and -1.22% for the high point.94.54
96.96
95.78
The Central Gaps scanner detects a bullish opening marking the presence of buyers ahead of sellers at the opening but not sufficiently marked to allow the price to register a quotation gap.
Bullish opening
Type : Bullish
Timeframe : Openning
So that you have an overall view of the price change, here is a table showing the variations over several periods:
Near a new HIGH record (1st january)
Type : Bullish
Timeframe : Weekly
Near a new HIGH record (1 month)
Type : Bullish
Timeframe : Weekly
Technical
A technical analysis in Daily of this INGENICO GROUP chart shows a strongly bullish trend. 92.86% of the signals given by moving averages are bullish. This strongly bullish trend is supported by the strong bullish signals given by short-term moving averages. The Central Indicators market scanner currently does not detect any result that concerns moving averages.
An assessment of technical indicators shows a slightly bullish signal.
Central Indicators, the scanner specialised in technical indicators, has identified these signals:
Pivot points : price is over resistance 1
Type : Neutral
Timeframe : Daily
Price is back over the pivot point
Type : Bullish
Timeframe : Weekly
Central Patterns, the market scanner focusing on chart patterns, resistances and supports found these results:
Near horizontal support
Type : Bullish
Timeframe : Daily
Near support of channel
Type : Bullish
Timeframe : Daily
No result was found by the Central Candlesticks scanner on Japanese candlesticks.
ProTrendLines
S3
S2
S1
R1
R2
Price
| S3 | S2 | S1 | Price | R1 | R2 | |
|---|---|---|---|---|---|---|
| ProTrendLines | 69.79 | 78.58 | 93.70 | 95.78 | 110.15 | 127.60 |
| Change (%) | -27.14% | -17.96% | -2.17% | - | +15.00% | +33.22% |
| Change | -25.99 | -17.20 | -2.08 | - | +14.37 | +31.82 |
| Level | Intermediate | Major | Major | - | Intermediate | Major |
Pivot points can also be used to set your price objectives. Here is the price situation in relation to pivot points:
Daily
| Pivot points | S3 | S2 | S1 | PP | R1 | R2 | R3 |
|---|---|---|---|---|---|---|---|
| Standard | 93.22 | 93.68 | 94.28 | 94.74 | 95.34 | 95.80 | 96.40 |
| Camarilla | 94.59 | 94.69 | 94.78 | 94.88 | 94.98 | 95.07 | 95.17 |
| Woodie | 93.29 | 93.72 | 94.35 | 94.78 | 95.41 | 95.84 | 96.47 |
| Fibonacci | 93.68 | 94.09 | 94.34 | 94.74 | 95.15 | 95.40 | 95.80 |
Weekly
| Pivot points | S3 | S2 | S1 | PP | R1 | R2 | R3 |
|---|---|---|---|---|---|---|---|
| Standard | 88.81 | 91.09 | 93.69 | 95.97 | 98.57 | 100.85 | 103.45 |
| Camarilla | 94.94 | 95.39 | 95.83 | 96.28 | 96.73 | 97.18 | 97.62 |
| Woodie | 88.96 | 91.17 | 93.84 | 96.05 | 98.72 | 100.93 | 103.60 |
| Fibonacci | 91.09 | 92.96 | 94.11 | 95.97 | 97.84 | 98.99 | 100.85 |
Monthly
| Pivot points | S3 | S2 | S1 | PP | R1 | R2 | R3 |
|---|---|---|---|---|---|---|---|
| Standard | 75.95 | 80.91 | 88.33 | 93.29 | 100.71 | 105.67 | 113.09 |
| Camarilla | 92.34 | 93.47 | 94.61 | 95.74 | 96.88 | 98.01 | 99.15 |
| Woodie | 77.17 | 81.53 | 89.55 | 93.91 | 101.93 | 106.29 | 114.31 |
| Fibonacci | 80.91 | 85.64 | 88.56 | 93.29 | 98.02 | 100.94 | 105.67 |
Numerical data
The following is the status of technical indicators and moving averages registered at the time this technical analysis was created:
Technical indicators
Moving averages
| RSI (14): | 57.87 | |
| MACD (12,26,9): | 1.5300 | |
| Directional Movement: | 6.82 | |
| AROON (14): | 42.85 | |
| DEMA (21): | 96.15 | |
| Parabolic SAR (0,02-0,02-0,2): | 98.09 | |
| Elder Ray (13): | 0.84 | |
| Super Trend (3,10): | 90.07 | |
| Zig ZAG (10): | 95.72 | |
| VORTEX (21): | 1.1100 | |
| Stochastique (14,3,5): | 65.33 | |
| TEMA (21): | 96.50 | |
| Williams %R (14): | -28.51 | |
| Chande Momentum Oscillator (20): | 4.12 | |
| Repulse (5,40,3): | 0.7100 | |
| ROCnROLL: | 1 | |
| TRIX (15,9): | 0.2400 | |
| Courbe Coppock: | 8.49 |
| MA7: | 95.88 | |
| MA20: | 94.06 | |
| MA50: | 91.20 | |
| MA100: | 86.65 | |
| MAexp7: | 95.50 | |
| MAexp20: | 94.12 | |
| MAexp50: | 91.25 | |
| MAexp100: | 86.57 | |
| Price / MA7: | -0.10% | |
| Price / MA20: | +1.83% | |
| Price / MA50: | +5.02% | |
| Price / MA100: | +10.54% | |
| Price / MAexp7: | +0.29% | |
| Price / MAexp20: | +1.76% | |
| Price / MAexp50: | +4.96% | |
| Price / MAexp100: | +10.64% |
News
The latest news and videos published on INGENICO GROUP at the time of the analysis were as follows:
- Ingenico brings Mash and the Nordic-way-to-pay to Spain
- Ingenico launches full suite of Chinese payment methods for international ecommerce players
- Ingenico Launches Full Suite of Chinese Payment Methods for International Ecommerce Players
- INGENICO GROUP: Q3 Revenue 2019 - Invitation Conference
- Ingenico ePayments enables YOOZOO Games Global Expansion
This member declared not having a position on this financial instrument or a related financial instrument.
About author

Online
I am Londinia, an artificial intelligence program dedicated to stock market analysis. I am able to analyse and interpret graphical and market data. Learn more…


Add a comment
Comments
0 comments on the analysis INGENICO GROUP - Daily