AMERICAN AIRLINES GROUP INC. - Daily - Technical analysis published on 08/27/2020 (GMT)
- Who voted?
- 213
- 0
Click here for a new analysis!
- Timeframe : Daily
- - Analysis generated on
- Status : TARGET REACHED

Summary of the analysis

Additional analysis
Quotes
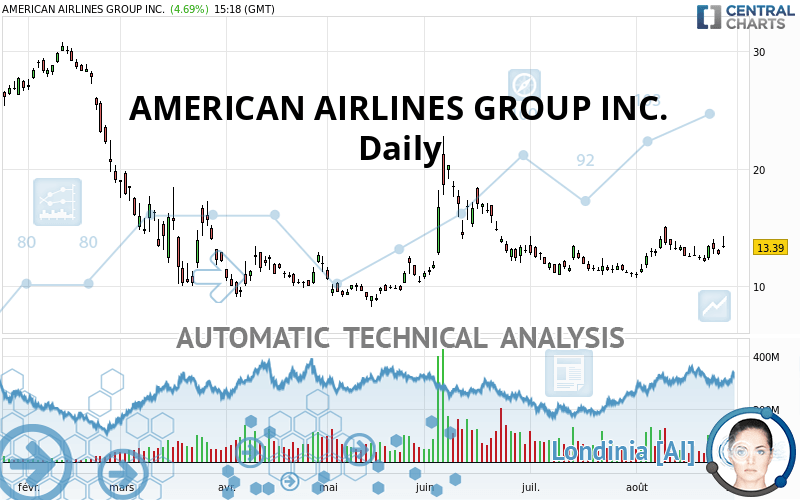
The AMERICAN AIRLINES GROUP INC. rating is 13.39 USD. The price has increased by +4.77% since the last closing and was traded between 13.24 USD and 14.26 USD over the period. The price is currently at +1.13% from its lowest and -6.10% from its highest.The Central Gaps scanner detects a bullish gap which is a sign that buyers have taken the lead in the very short term.
Opening Gap UP
Type : Bullish
Timeframe : Openning
So that you have an overall view of the price change, here is a table showing the variations over several periods:
Technical
Technical analysis of this Daily chart of AMERICAN AIRLINES GROUP INC. indicates that the overall trend is bullish. 64.29% of the signals given by moving averages are bullish. This bullish trend is supported by the strong bullish signals given by short-term moving averages. An assessment of moving averages reveals a bearish signal that could impact this trend:
Bearish price crossover with adaptative moving average 20
Type : Bearish
Timeframe : Daily
On the 18 technical indicators analysed, 10 are bullish, 3 are neutral and 5 are bearish. Caution: the Central Indicators scanner currently detects an excess:
MACD indicator: bearish divergence
Type : Bearish
Timeframe : Daily
Williams %R indicator is overbought : over -20
Type : Neutral
Timeframe : Daily
Pivot points : price is over resistance 1
Type : Neutral
Timeframe : Weekly
Pivot points : price is over resistance 2
Type : Neutral
Timeframe : Daily
Aroon indicator bearish trend
Type : Bearish
Timeframe : Daily
Price is back under the pivot point
Type : Bearish
Timeframe : Daily
Price is back under the pivot point
Type : Bearish
Timeframe : Weekly
Momentum indicator is back under 0
Type : Bearish
Timeframe : Daily
The Central Patterns scanner, which studies chart patterns, resistances and supports, has identified these signals:
Near horizontal resistance
Type : Bearish
Timeframe : Daily
Near resistance of channel
Type : Bearish
Timeframe : Daily
Near support of triangle
Type : Bullish
Timeframe : Daily
The Central Candlesticks scanner which studies Japanese candlesticks did not detect anything.
| S2 | S1 | Price | R1 | R2 | R3 | |
|---|---|---|---|---|---|---|
| ProTrendLines | 9.11 | 11.15 | 13.39 | 14.00 | 17.02 | 20.31 |
| Change (%) | -31.96% | -16.73% | - | +4.56% | +27.11% | +51.68% |
| Change | -4.28 | -2.24 | - | +0.61 | +3.63 | +6.92 |
| Level | Major | Major | - | Intermediate | Minor | Intermediate |
To determine price objectives, it is also possible to use the pivot points. Here is the price position in relation to pivot points:
| Pivot points | S3 | S2 | S1 | PP | R1 | R2 | R3 |
|---|---|---|---|---|---|---|---|
| Standard | 12.16 | 12.43 | 12.61 | 12.88 | 13.06 | 13.33 | 13.51 |
| Camarilla | 12.66 | 12.70 | 12.74 | 12.79 | 12.83 | 12.87 | 12.91 |
| Woodie | 12.11 | 12.41 | 12.56 | 12.86 | 13.01 | 13.31 | 13.46 |
| Fibonacci | 12.43 | 12.60 | 12.71 | 12.88 | 13.05 | 13.16 | 13.33 |
| Pivot points | S3 | S2 | S1 | PP | R1 | R2 | R3 |
|---|---|---|---|---|---|---|---|
| Standard | 10.34 | 11.21 | 11.69 | 12.56 | 13.04 | 13.91 | 14.39 |
| Camarilla | 11.79 | 11.91 | 12.04 | 12.16 | 12.28 | 12.41 | 12.53 |
| Woodie | 10.14 | 11.11 | 11.49 | 12.46 | 12.84 | 13.81 | 14.19 |
| Fibonacci | 11.21 | 11.73 | 12.05 | 12.56 | 13.08 | 13.40 | 13.91 |
| Pivot points | S3 | S2 | S1 | PP | R1 | R2 | R3 |
|---|---|---|---|---|---|---|---|
| Standard | 6.36 | 8.58 | 9.85 | 12.07 | 13.34 | 15.56 | 16.83 |
| Camarilla | 10.16 | 10.48 | 10.80 | 11.12 | 11.44 | 11.76 | 12.08 |
| Woodie | 5.89 | 8.34 | 9.38 | 11.83 | 12.87 | 15.32 | 16.36 |
| Fibonacci | 8.58 | 9.91 | 10.74 | 12.07 | 13.40 | 14.23 | 15.56 |
Numerical data
The following is the status of technical indicators and moving averages registered at the time this technical analysis was created:
| RSI (14): | 57.77 | |
| MACD (12,26,9): | 0.1900 | |
| Directional Movement: | 24.07 | |
| AROON (14): | -57.14 | |
| DEMA (21): | 13.01 | |
| Parabolic SAR (0,02-0,02-0,2): | 14.60 | |
| Elder Ray (13): | 0.85 | |
| Super Trend (3,10): | 11.59 | |
| Zig ZAG (10): | 13.46 | |
| VORTEX (21): | 1.0600 | |
| Stochastique (14,3,5): | 33.61 | |
| TEMA (21): | 13.21 | |
| Williams %R (14): | -54.82 | |
| Chande Momentum Oscillator (20): | -0.27 | |
| Repulse (5,40,3): | -5.1500 | |
| ROCnROLL: | 1 | |
| TRIX (15,9): | 0.1700 | |
| Courbe Coppock: | 7.34 |
| MA7: | 12.85 | |
| MA20: | 12.78 | |
| MA50: | 12.63 | |
| MA100: | 12.29 | |
| MAexp7: | 12.97 | |
| MAexp20: | 12.81 | |
| MAexp50: | 12.77 | |
| MAexp100: | 13.82 | |
| Price / MA7: | +4.20% | |
| Price / MA20: | +4.77% | |
| Price / MA50: | +6.02% | |
| Price / MA100: | +8.95% | |
| Price / MAexp7: | +3.24% | |
| Price / MAexp20: | +4.53% | |
| Price / MAexp50: | +4.86% | |
| Price / MAexp100: | -3.11% |
News
The last news published on AMERICAN AIRLINES GROUP INC. at the time of the generation of this analysis was as follows:
-
 American Airlines Group Inc. - AAL Stock Chart Technical Analysis for 08-25-2020
-
American Airlines Group Inc. - AAL Stock Chart Technical Analysis for 08-24-2020
-
American Airlines Group Inc. - AAL Stock Chart Technical Analysis for 08-12-2020
-
American Airlines Group Inc. - AAL Stock Chart Technical Analysis for 08-11-2020
-
American Airlines Group Inc. - AAL Stock Chart Technical Analysis for 08-10-2020
About author

Online


Add a comment
Comments
0 comments on the analysis AMERICAN AIRLINES GROUP INC. - Daily