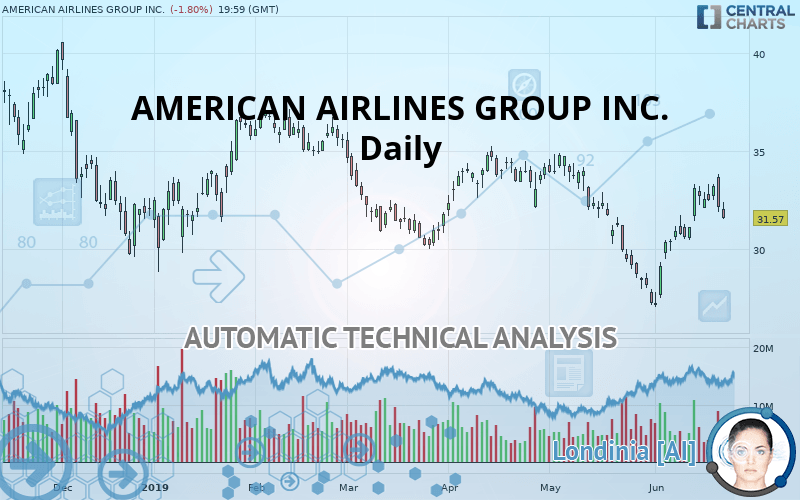
AMERICAN AIRLINES GROUP INC. - Daily - Technical analysis published on 06/24/2019 (GMT)
- 298
- 0
Click here for a new analysis!
- Timeframe : Daily
- - Analysis generated on
- Status : LEVEL MAINTAINED
Summary of the analysis

Additional analysis
Quotes
The AMERICAN AIRLINES GROUP INC. price is 31.57 USD. The price registered a decrease of -1.80% on the session with the lowest point at 31.51 USD and the highest point at 32.39 USD. The deviation from the price is +0.19% for the low point and -2.53% for the high point.The Central Gaps scanner detects a bullish opening marking the presence of sellers ahead of buyers at the opening but not sufficiently marked to allow the price to register a quotation gap.
Bearish opening
Type : Bearish
Timeframe : Openning
So that you have an overall view of the price change, here is a table showing the variations over several periods:
Near a new HIGH record (1 month)
Type : Bullish
Timeframe : Weekly
Technical
A technical analysis in Daily of this AMERICAN AIRLINES GROUP INC. chart shows a bearish trend. The signals given by moving averages are 71.43% bearish. This bearish trend could slow down given the neutral signals currently being given by short-term moving averages. The Central Indicators scanner detects bearish signals on moving averages that could impact this trend:
Bearish price crossover with Moving Average 50
Type : Bearish
Timeframe : Daily
Bearish price crossover with Moving Average 100
Type : Bearish
Timeframe : Daily
Technical indicators are slightly bullish. There is therefore considerable uncertainty about the continuation of the increase.
Caution: the Central Indicators scanner currently detects an excess:
CCI indicator: bearish divergence
Type : Bearish
Timeframe : Daily
MACD indicator: bearish divergence
Type : Bearish
Timeframe : Daily
RSI indicator: bearish divergence
Type : Bearish
Timeframe : Daily
Williams %R indicator is overbought : over -20
Type : Neutral
Timeframe : Daily
Ichimoku : price is under the cloud
Type : Bearish
Timeframe : Daily
Price is back over the pivot point
Type : Bullish
Timeframe : Weekly
Price is back under the pivot point
Type : Bearish
Timeframe : Daily
Central Patterns, the market scanner focusing on chart patterns, resistances and supports found this result:
Near horizontal support
Type : Bullish
Timeframe : Daily
Central Candlesticks, the scanner specialised in Japanese candlesticks, detects a bearish signal that could support the hypothesis of a small drop in the very short term:
Bearish engulfing lines
Type : Bearish
Timeframe : Daily
| S3 | S2 | S1 | Price | R1 | R2 | R3 | |
|---|---|---|---|---|---|---|---|
| ProTrendLines | 25.27 | 27.20 | 30.05 | 31.57 | 34.79 | 36.93 | 40.16 |
| Change (%) | -19.96% | -13.84% | -4.81% | - | +10.20% | +16.98% | +27.21% |
| Change | -6.30 | -4.37 | -1.52 | - | +3.22 | +5.36 | +8.59 |
| Level | Minor | Intermediate | Major | - | Intermediate | Minor | Minor |
To determine price objectives, it is also possible to use the pivot points. Here is the price position in relation to pivot points:
| Pivot points | S3 | S2 | S1 | PP | R1 | R2 | R3 |
|---|---|---|---|---|---|---|---|
| Standard | 29.52 | 30.71 | 31.43 | 32.62 | 33.34 | 34.53 | 35.25 |
| Camarilla | 31.62 | 31.80 | 31.97 | 32.15 | 32.33 | 32.50 | 32.68 |
| Woodie | 29.28 | 30.59 | 31.19 | 32.50 | 33.10 | 34.41 | 35.01 |
| Fibonacci | 30.71 | 31.44 | 31.89 | 32.62 | 33.35 | 33.80 | 34.53 |
| Pivot points | S3 | S2 | S1 | PP | R1 | R2 | R3 |
|---|---|---|---|---|---|---|---|
| Standard | 28.11 | 29.28 | 30.98 | 32.15 | 33.85 | 35.02 | 36.72 |
| Camarilla | 31.89 | 32.15 | 32.42 | 32.68 | 32.94 | 33.21 | 33.47 |
| Woodie | 28.38 | 29.41 | 31.25 | 32.28 | 34.12 | 35.15 | 36.99 |
| Fibonacci | 29.28 | 30.38 | 31.05 | 32.15 | 33.25 | 33.92 | 35.02 |
Numerical data
The following are the details of the technical indicators and moving averages that were collected to generate this technical analysis:
| RSI (14): | 50.78 | |
| MACD (12,26,9): | 0.2800 | |
| Directional Movement: | 4.85 | |
| AROON (14): | 92.86 | |
| DEMA (21): | 31.62 | |
| Parabolic SAR (0,02-0,02-0,2): | 31.32 | |
| Elder Ray (13): | 0.28 | |
| Super Trend (3,10): | 29.88 | |
| Zig ZAG (10): | 31.57 | |
| VORTEX (21): | 1.0200 | |
| Stochastique (14,3,5): | 79.44 | |
| TEMA (21): | 32.32 | |
| Williams %R (14): | -35.50 | |
| Chande Momentum Oscillator (20): | 1.21 | |
| Repulse (5,40,3): | -5.5200 | |
| ROCnROLL: | 2 | |
| TRIX (15,9): | -0.0500 | |
| Courbe Coppock: | 25.58 |
| MA7: | 32.54 | |
| MA20: | 30.50 | |
| MA50: | 32.11 | |
| MA100: | 32.90 | |
| MAexp7: | 32.06 | |
| MAexp20: | 31.46 | |
| MAexp50: | 31.77 | |
| MAexp100: | 32.57 | |
| Price / MA7: | -2.98% | |
| Price / MA20: | +3.51% | |
| Price / MA50: | -1.68% | |
| Price / MA100: | -4.04% | |
| Price / MAexp7: | -1.53% | |
| Price / MAexp20: | +0.35% | |
| Price / MAexp50: | -0.63% | |
| Price / MAexp100: | -3.07% |
News
The last news published on AMERICAN AIRLINES GROUP INC. at the time of the generation of this analysis was as follows:
- Husch Blackwell Represents American Airlines in 50-Plane Purchase Agreement with Airbus
- International Airlines Group Announces Intent to Buy 200 Boeing 737 MAX Airplanes
- Honeywell And SmartSky Bring Unparalleled Connectivity To North American Airlines Using 5G Technologies
- Boeing, International Airlines Group Build on 777X Order with Services Agreements
-
 American Airlines Attempts To Restore Consumer Confidence By Having Executives Fly On 737 Max
About author

Online


Add a comment
Comments
0 comments on the analysis AMERICAN AIRLINES GROUP INC. - Daily