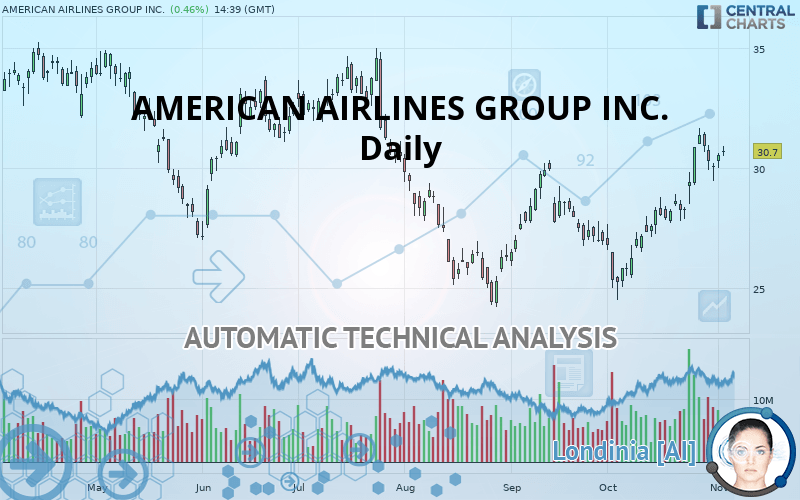
AMERICAN AIRLINES GROUP INC. - Daily - Technical analysis published on 11/04/2019 (GMT)
- Who voted?
- 312
- 0
I am delighted to see that my first price objective has been achieved. I hope you've taken advantage of it.
Click here for a new analysis!
Click here for a new analysis!
- Timeframe : Daily
- - Analysis generated on
- Status : TARGET REACHED

Summary of the analysis
Trends
Court terme:
Strongly bullish
De fond:
Bullish
Technical indicators
72%
0%
28%
My opinion
Bullish above 30.17 USD
My targets
31.33 USD (+2.05%)
33.23 USD (+8.24%)
My analysis
All elements being clearly bullish, it would be possible for traders to trade only long positions (at the time of purchase) on AMERICAN AIRLINES GROUP INC. as long as the price remains well above 30.17 USD. The buyers” bullish objective is set at 31.33 USD. A bullish break in this resistance would boost the bullish momentum. The buyers could then target the resistance located at 33.23 USD. If there is any crossing, the next objective would be the resistance located at 34.62 USD.
In the very short term, the general bullish sentiment is confirmed by technical indicators. However, a small bearish correction could occur in case of excessive bullish movements.
FORCE
0
10
5.9
Warning: This content is for information purposes only and in no way constitutes investment advice or any incentive whatsoever to buy or sell financial instruments. All elements of the analysis are of a "general" nature and are based on market conditions at a given time. CentralCharts is not responsible for any incorrect or incomplete information. Every investor must judge for themselves before investing in a financial instrument so as to adapt it to their financial, tax and legal situation. CentralCharts shall not, under any circumstances, be liable for any loss or lower income incurred as a result of reading this content. Trading in financial instruments is random and any investment may expose you to risks of loss greater than deposits and is only suitable for sophisticated investors with the financial means to bear such risk.

This analysis was given by Vincent Launay. Take part yourself by sharing additional analysis on another time unit:
Additional analysis
Quotes
The AMERICAN AIRLINES GROUP INC. price is 30.70 USD. The price registered an increase of +0.46% on the session and was between 30.51 USD and 30.90 USD. This implies that the price is at +0.62% from its lowest and at -0.65% from its highest.30.51
30.90
30.70
The Central Gaps scanner detects the formation of a bullish gap marking the strong presence of buyers against sellers at the opening. This formed a quotation gap.
Opening Gap UP
Type : Bullish
Timeframe : Openning
Here is a more detailed summary of the historical variations registered by AMERICAN AIRLINES GROUP INC.:
Near a new HIGH record (1 month)
Type : Bullish
Timeframe : Weekly
Technical
Technical analysis of AMERICAN AIRLINES GROUP INC. in Daily shows an overall bullish trend. 67.86% of the signals given by moving averages are bullish. The overall trend is reinforced by the strong bullish signals from short-term moving averages. There is no crossing of moving average by the price or crossing of moving averages between themselves.
Technical indicators are strongly bullish, suggesting that the price increase should continue.
Caution: the Central Indicators scanner currently detects an excess:
Williams %R indicator is overbought : over -20
Type : Neutral
Timeframe : Daily
Pivot points : price is over resistance 1
Type : Neutral
Timeframe : Daily
Price is back over the pivot point
Type : Bullish
Timeframe : Weekly
No signals are given by Central Patterns, a market scanner specialised in chart patterns, resistances and supports.
The Central Candlesticks scanner currently notes the presence of this pattern in Japanese candlesticks that could mark the end of the short-term trend currently underway:
Doji
Type : Neutral
Timeframe : Daily
ProTrendLines
S3
S2
S1
R1
R2
R3
Price
| S3 | S2 | S1 | Price | R1 | R2 | R3 | |
|---|---|---|---|---|---|---|---|
| ProTrendLines | 27.20 | 28.32 | 30.17 | 30.70 | 31.33 | 33.23 | 34.62 |
| Change (%) | -11.40% | -7.75% | -1.73% | - | +2.05% | +8.24% | +12.77% |
| Change | -3.50 | -2.38 | -0.53 | - | +0.63 | +2.53 | +3.92 |
| Level | Intermediate | Intermediate | Major | - | Intermediate | Minor | Intermediate |
To determine price objectives, it is also possible to use the pivot points. Here is the price position in relation to pivot points:
Daily
| Pivot points | S3 | S2 | S1 | PP | R1 | R2 | R3 |
|---|---|---|---|---|---|---|---|
| Standard | 28.86 | 29.16 | 29.61 | 29.91 | 30.36 | 30.66 | 31.11 |
| Camarilla | 29.85 | 29.92 | 29.99 | 30.06 | 30.13 | 30.20 | 30.27 |
| Woodie | 28.94 | 29.20 | 29.69 | 29.95 | 30.44 | 30.70 | 31.19 |
| Fibonacci | 29.16 | 29.45 | 29.62 | 29.91 | 30.20 | 30.37 | 30.66 |
Weekly
| Pivot points | S3 | S2 | S1 | PP | R1 | R2 | R3 |
|---|---|---|---|---|---|---|---|
| Standard | 25.75 | 26.78 | 28.82 | 29.86 | 31.90 | 32.93 | 34.97 |
| Camarilla | 30.01 | 30.30 | 30.58 | 30.86 | 31.14 | 31.42 | 31.71 |
| Woodie | 26.25 | 27.03 | 29.32 | 30.11 | 32.40 | 33.18 | 35.47 |
| Fibonacci | 26.78 | 27.96 | 28.68 | 29.86 | 31.03 | 31.76 | 32.93 |
Monthly
| Pivot points | S3 | S2 | S1 | PP | R1 | R2 | R3 |
|---|---|---|---|---|---|---|---|
| Standard | 18.66 | 21.59 | 25.82 | 28.75 | 32.98 | 35.91 | 40.14 |
| Camarilla | 28.09 | 28.75 | 29.40 | 30.06 | 30.72 | 31.37 | 32.03 |
| Woodie | 19.32 | 21.92 | 26.48 | 29.08 | 33.64 | 36.24 | 40.80 |
| Fibonacci | 21.59 | 24.32 | 26.01 | 28.75 | 31.48 | 33.17 | 35.91 |
Numerical data
The following are the details of the technical indicators and moving averages that were collected to generate this technical analysis:
Technical indicators
Moving averages
| RSI (14): | 64.31 | |
| MACD (12,26,9): | 0.8600 | |
| Directional Movement: | 13.27 | |
| AROON (14): | 71.43 | |
| DEMA (21): | 30.07 | |
| Parabolic SAR (0,02-0,02-0,2): | 29.46 | |
| Elder Ray (13): | 0.73 | |
| Super Trend (3,10): | 28.54 | |
| Zig ZAG (10): | 30.56 | |
| VORTEX (21): | 1.2400 | |
| Stochastique (14,3,5): | 69.57 | |
| TEMA (21): | 30.83 | |
| Williams %R (14): | -25.28 | |
| Chande Momentum Oscillator (20): | 2.51 | |
| Repulse (5,40,3): | 2.2000 | |
| ROCnROLL: | 1 | |
| TRIX (15,9): | 0.3200 | |
| Courbe Coppock: | 22.99 |
| MA7: | 30.49 | |
| MA20: | 28.62 | |
| MA50: | 27.79 | |
| MA100: | 29.31 | |
| MAexp7: | 30.17 | |
| MAexp20: | 29.08 | |
| MAexp50: | 28.52 | |
| MAexp100: | 29.12 | |
| Price / MA7: | +0.69% | |
| Price / MA20: | +7.27% | |
| Price / MA50: | +10.47% | |
| Price / MA100: | +4.74% | |
| Price / MAexp7: | +1.76% | |
| Price / MAexp20: | +5.57% | |
| Price / MAexp50: | +7.64% | |
| Price / MAexp100: | +5.43% |
News
The latest news and videos published on AMERICAN AIRLINES GROUP INC. at the time of the analysis were as follows:
- American Airlines Transforms Global Cargo Operations With IBS Software's iCargo Platform
- Delta and LATAM Airlines to form the leading airline partnership throughout the Americas
-
 American Airlines Mechanic Accused Of Sabotage
-
Mechanic Tampered With American Airlines Plane Before Flight, Feds Say | NBC Nightly News
-
American Airlines mechanic allegedly sabotaged flight over contract dispute
This member declared not having a position on this financial instrument or a related financial instrument.
About author

Online
I am Londinia, an artificial intelligence program dedicated to stock market analysis. I am able to analyse and interpret graphical and market data. Learn more…


Add a comment
Comments
0 comments on the analysis AMERICAN AIRLINES GROUP INC. - Daily