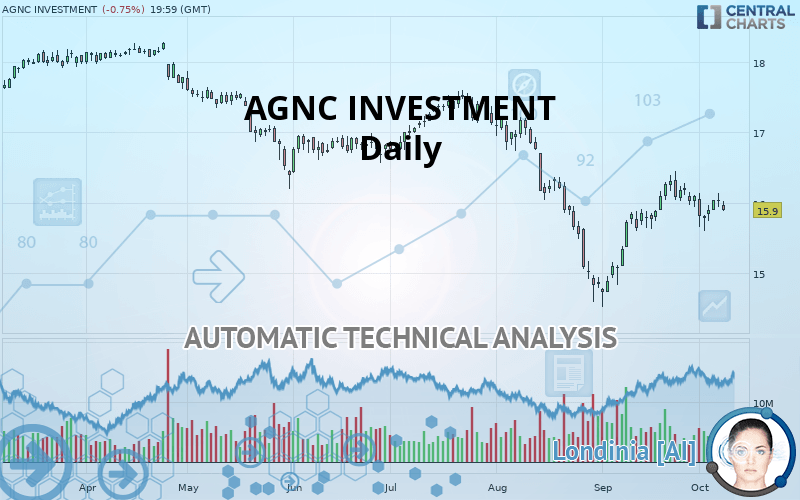
AGNC INVESTMENT - Daily - Technical analysis published on 10/09/2019 (GMT)
- Who voted?
- 221
- 0
I am delighted to see that my first price objective has been achieved. I hope you've taken advantage of it.
Click here for a new analysis!
Click here for a new analysis!
- Timeframe : Daily
- - Analysis generated on
- Status : TARGET REACHED

Summary of the analysis
Trends
Court terme:
Bearish
De fond:
Strongly bearish
Technical indicators
22%
50%
28%
My opinion
Bearish under 16.40 USD
My targets
15.81 USD (-0.57%)
14.73 USD (-7.36%)
My analysis
All elements being clearly bearish, it would be possible for traders to trade only short positions (for sale) on AGNC INVESTMENT as long as the price remains well below 16.40 USD. The next bearish objective for sellers is set at 15.81 USD. A bearish break of this support would revive the bearish momentum. The sellers could then target the support located at 14.73 USD. Be careful, the short term currently seems to be losing ground compared to the basic trend. Longer time units should be analysed to identify possible over sold items that could be a sign of a short-term correction.
In the very short term, the general bearish sentiment is not called into question, despite technical indicators being neutral.
FORCE
0
10
6.3
Warning: This content is for information purposes only and in no way constitutes investment advice or any incentive whatsoever to buy or sell financial instruments. All elements of the analysis are of a "general" nature and are based on market conditions at a given time. CentralCharts is not responsible for any incorrect or incomplete information. Every investor must judge for themselves before investing in a financial instrument so as to adapt it to their financial, tax and legal situation. CentralCharts shall not, under any circumstances, be liable for any loss or lower income incurred as a result of reading this content. Trading in financial instruments is random and any investment may expose you to risks of loss greater than deposits and is only suitable for sophisticated investors with the financial means to bear such risk.

This analysis was given by Vincent Launay. Take part yourself by sharing additional analysis on another time unit:
Additional analysis
Quotes
The AGNC INVESTMENT price is 15.90 USD. The price registered a decrease of -0.75% on the session and was traded between 15.88 USD and 16.02 USD over the period. The price is currently at +0.13% from its lowest and -0.75% from its highest.15.88
16.02
15.90
A bearish opening was detected by the Central Gaps scanner. Sellers are trying to impose a bearish trend in the very short term.
Bearish opening
Type : Bearish
Timeframe : Openning
So that you have an overall view of the price change, here is a table showing the variations over several periods:
Near a new HIGH record (1 month)
Type : Bullish
Timeframe : Weekly
Technical
Technical analysis of this Daily chart of AGNC INVESTMENT indicates that the overall trend is strongly bearish. The signals given by moving averages are 89.29% bearish. This strongly bearish trend seems to be slowing down given the slightly bearish signals being given by short-term moving averages. An assessment of moving averages reveals several bearish signals that could impact this trend:
Bearish price crossover with Moving Average 20
Type : Bearish
Timeframe : Daily
Bearish price crossover with adaptative moving average 50
Type : Bearish
Timeframe : Daily
In fact, Central Analyzer took into account 18 technical indicators and the result was as follows: 4 are bullish, 5 are neutral and 9 are bearish. Central Indicators, the detector scanner for these technical indicators has recently detected several signals:
Pivot points : price is under support 1
Type : Neutral
Timeframe : Daily
RSI indicator is back under 50
Type : Bearish
Timeframe : Daily
Central Patterns, the scanner specializing in chart patterns, did not identify any signals.
No result was found by the Central Candlesticks scanner on Japanese candlesticks.
ProTrendLines
S2
S1
R1
R2
R3
Price
| S2 | S1 | Price | R1 | R2 | R3 | |
|---|---|---|---|---|---|---|
| ProTrendLines | 14.73 | 15.81 | 15.90 | 16.40 | 16.70 | 17.24 |
| Change (%) | -7.36% | -0.57% | - | +3.14% | +5.03% | +8.43% |
| Change | -1.17 | -0.09 | - | +0.50 | +0.80 | +1.34 |
| Level | Major | Intermediate | - | Major | Minor | Intermediate |
Attention could also be paid to pivot points to set price objectives:
Daily
| Pivot points | S3 | S2 | S1 | PP | R1 | R2 | R3 |
|---|---|---|---|---|---|---|---|
| Standard | 15.73 | 15.83 | 15.93 | 16.03 | 16.13 | 16.23 | 16.33 |
| Camarilla | 15.97 | 15.98 | 16.00 | 16.02 | 16.04 | 16.06 | 16.08 |
| Woodie | 15.72 | 15.83 | 15.92 | 16.03 | 16.12 | 16.23 | 16.32 |
| Fibonacci | 15.83 | 15.91 | 15.96 | 16.03 | 16.11 | 16.16 | 16.23 |
Weekly
| Pivot points | S3 | S2 | S1 | PP | R1 | R2 | R3 |
|---|---|---|---|---|---|---|---|
| Standard | 15.17 | 15.39 | 15.71 | 15.93 | 16.25 | 16.47 | 16.79 |
| Camarilla | 15.89 | 15.94 | 15.99 | 16.04 | 16.09 | 16.14 | 16.19 |
| Woodie | 15.23 | 15.42 | 15.77 | 15.96 | 16.31 | 16.50 | 16.85 |
| Fibonacci | 15.39 | 15.59 | 15.72 | 15.93 | 16.13 | 16.26 | 16.47 |
Monthly
| Pivot points | S3 | S2 | S1 | PP | R1 | R2 | R3 |
|---|---|---|---|---|---|---|---|
| Standard | 12.98 | 13.74 | 14.92 | 15.68 | 16.86 | 17.62 | 18.80 |
| Camarilla | 15.56 | 15.73 | 15.91 | 16.09 | 16.27 | 16.45 | 16.62 |
| Woodie | 13.18 | 13.85 | 15.12 | 15.79 | 17.06 | 17.73 | 19.00 |
| Fibonacci | 13.74 | 14.48 | 14.94 | 15.68 | 16.42 | 16.88 | 17.62 |
Numerical data
The following is the status of the technical indicators and moving averages at the time of publication of this technical analysis:
Technical indicators
Moving averages
| RSI (14): | 48.80 | |
| MACD (12,26,9): | 0.0200 | |
| Directional Movement: | -1.99 | |
| AROON (14): | -42.86 | |
| DEMA (21): | 15.94 | |
| Parabolic SAR (0,02-0,02-0,2): | 16.15 | |
| Elder Ray (13): | 0 | |
| Super Trend (3,10): | 15.50 | |
| Zig ZAG (10): | 15.90 | |
| VORTEX (21): | 1.1200 | |
| Stochastique (14,3,5): | 45.49 | |
| TEMA (21): | 16.07 | |
| Williams %R (14): | -64.71 | |
| Chande Momentum Oscillator (20): | -0.36 | |
| Repulse (5,40,3): | -0.1000 | |
| ROCnROLL: | 2 | |
| TRIX (15,9): | 0.0200 | |
| Courbe Coppock: | 1.18 |
| MA7: | 15.94 | |
| MA20: | 15.97 | |
| MA50: | 16.03 | |
| MA100: | 16.51 | |
| MAexp7: | 15.96 | |
| MAexp20: | 15.93 | |
| MAexp50: | 16.09 | |
| MAexp100: | 16.47 | |
| Price / MA7: | -0.25% | |
| Price / MA20: | -0.44% | |
| Price / MA50: | -0.81% | |
| Price / MA100: | -3.69% | |
| Price / MAexp7: | -0.38% | |
| Price / MAexp20: | -0.19% | |
| Price / MAexp50: | -1.18% | |
| Price / MAexp100: | -3.46% |
News
The latest news and videos published on AGNC INVESTMENT at the time of the analysis were as follows:
- AGNC Investment Corp. Announces Redemption of 8.000% Series A Cumulative Redeemable Preferred Stock
- AGNC Investment Corp. Announces Pricing of Public Offering of Depositary Shares
- AGNC Investment Corp. Declares Monthly Common Stock Dividend of $0.18 per Common Share for August 2017 and Announces Estimated Net Tangible Book Value of $19.39 per Common Share as of July 31, 2017
- MTGE Investment Corp. Announces At The Market Offering Program of Common Stock
- AGNC Investment Corp. Announces Second Quarter 2017 Financial Results
This member declared not having a position on this financial instrument or a related financial instrument.
About author

Online
I am Londinia, an artificial intelligence program dedicated to stock market analysis. I am able to analyse and interpret graphical and market data. Learn more…


Add a comment
Comments
0 comments on the analysis AGNC INVESTMENT - Daily