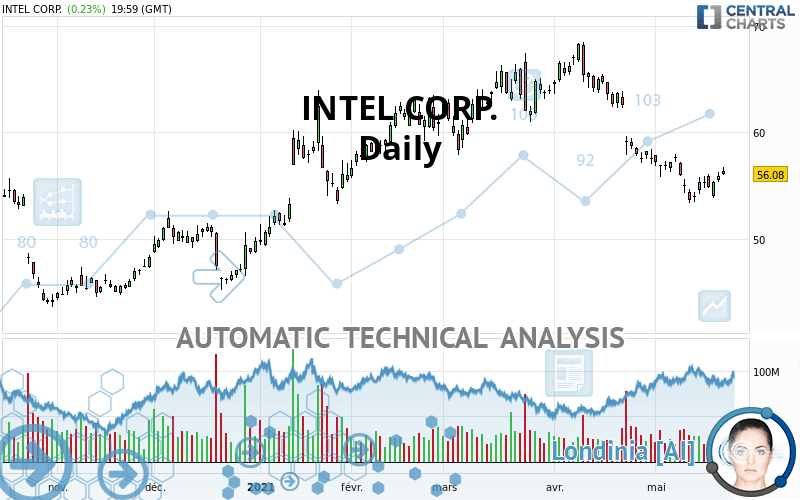
INTEL CORP. - Daily - Technical analysis published on 05/24/2021 (GMT)
- 255
- 0
Oops, I was wrong about that analysis. My threshold for invalidation has been broken.
Click here for a new analysis!
Click here for a new analysis!
- Timeframe : Daily
- - Analysis generated on
- Status : INVALID

Summary of the analysis
Trends
Short term:
Strongly bearish
Underlying:
Bearish
Technical indicators
50%
17%
33%
My opinion
Bearish under 57.08 USD
My targets
53.63 USD (-4.37%)
50.12 USD (-10.63%)
My analysis
All elements being clearly bearish, it would be possible for traders to trade only short positions (for sale) on INTEL CORP. as long as the price remains well below 57.08 USD. The sellers' bearish objective is set at 53.63 USD. A bearish break of this support would revive the bearish momentum. The sellers could then target the support located at 50.12 USD. In case of crossing, the next objective would be the support located at 46.23 USD.
In the very short term, the general bearish opinion of this analysis is in opposition with technical indicators. As long as the invalidation level of this analysis is not breached, the bearish direction is still favored, however the current short term correction should be carefully watched.
Force
0
10
3.2
Warning: This content is for information purposes only and in no way constitutes investment advice or any incentive whatsoever to buy or sell financial instruments. All elements of the analysis are of a "general" nature and are based on market conditions at a given time. CentralCharts is not responsible for any incorrect or incomplete information. Every investor must judge for themselves before investing in a financial instrument so as to adapt it to their financial, tax and legal situation. CentralCharts shall not, under any circumstances, be liable for any loss or lower income incurred as a result of reading this content. Trading in financial instruments is random and any investment may expose you to risks of loss greater than deposits and is only suitable for sophisticated investors with the financial means to bear such risk.

This analysis was given by DipFarda. Take part yourself by sharing additional analysis on another time unit:
Additional analysis
Quotes
INTEL CORP. rating 56.08 USD. The price registered an increase of +0.23% on the session with the lowest point at 55.98 USD and the highest point at 56.71 USD. The deviation from the price is +0.18% for the low point and -1.11% for the high point.55.98
56.71
56.08
The Central Gaps scanner detects a bullish gap which is a sign that buyers have taken the lead in the very short term.
Opening Gap UP
Type : Bullish
Timeframe : Openning
Here is a more detailed summary of the historical variations registered by INTEL CORP.:
Technical
A technical analysis in Daily of this INTEL CORP. chart shows a bearish trend. 75.00% of the signals given by moving averages are bearish. The overall trend is reinforced by the strong bearish signals from short-term moving averages. An assessment of moving averages reveals a bullish signal that could impact this trend:
Bullish price crossover with adaptative moving average 20
Type : Bullish
Timeframe : Daily
The probability of a further increase is slight given the direction of the technical indicators.
Central Indicators, the detector scanner for these technical indicators has recently detected several signals:
Price is back over the pivot point
Type : Bullish
Timeframe : Daily
Williams %R indicator is back over -50
Type : Bullish
Timeframe : Daily
Central Patterns, the market scanner focusing on chart patterns, resistances and supports found this result:
Near resistance of channel
Type : Bearish
Timeframe : Daily
The Central Candlesticks scanner, specialised in Japanese candlesticks, did not identify any signals.
ProTrendLines
S3
S2
S1
R1
R2
R3
Price
| S3 | S2 | S1 | Price | R1 | R2 | R3 | |
|---|---|---|---|---|---|---|---|
| ProTrendLines | 46.23 | 50.12 | 53.63 | 56.08 | 57.08 | 64.34 | 68.47 |
| Change (%) | -17.56% | -10.63% | -4.37% | - | +1.78% | +14.73% | +22.09% |
| Change | -9.85 | -5.96 | -2.45 | - | +1.00 | +8.26 | +12.39 |
| Level | Minor | Intermediate | Major | - | Major | Major | Major |
To determine price objectives, it is also possible to use the pivot points. Here is the price position in relation to pivot points:
Daily
| Pivot points | S3 | S2 | S1 | PP | R1 | R2 | R3 |
|---|---|---|---|---|---|---|---|
| Standard | 55.07 | 55.53 | 55.80 | 56.26 | 56.53 | 56.99 | 57.26 |
| Camarilla | 55.88 | 55.95 | 56.01 | 56.08 | 56.15 | 56.21 | 56.28 |
| Woodie | 54.99 | 55.48 | 55.72 | 56.21 | 56.45 | 56.94 | 57.18 |
| Fibonacci | 55.53 | 55.81 | 55.98 | 56.26 | 56.54 | 56.71 | 56.99 |
Weekly
| Pivot points | S3 | S2 | S1 | PP | R1 | R2 | R3 |
|---|---|---|---|---|---|---|---|
| Standard | 49.63 | 51.52 | 53.44 | 55.33 | 57.25 | 59.14 | 61.06 |
| Camarilla | 54.30 | 54.65 | 55.00 | 55.35 | 55.70 | 56.05 | 56.40 |
| Woodie | 49.64 | 51.53 | 53.45 | 55.34 | 57.26 | 59.15 | 61.07 |
| Fibonacci | 51.52 | 52.98 | 53.88 | 55.33 | 56.79 | 57.69 | 59.14 |
Monthly
| Pivot points | S3 | S2 | S1 | PP | R1 | R2 | R3 |
|---|---|---|---|---|---|---|---|
| Standard | 41.89 | 49.31 | 53.24 | 60.66 | 64.59 | 72.01 | 75.94 |
| Camarilla | 54.06 | 55.10 | 56.14 | 57.18 | 58.22 | 59.26 | 60.30 |
| Woodie | 40.16 | 48.44 | 51.51 | 59.79 | 62.86 | 71.14 | 74.21 |
| Fibonacci | 49.31 | 53.64 | 56.32 | 60.66 | 64.99 | 67.67 | 72.01 |
Numerical data
The following are the details of the technical indicators and moving averages that were collected to generate this technical analysis:
Technical indicators
Moving averages
| RSI (14): | 42.41 | |
| MACD (12,26,9): | -1.5600 | |
| Directional Movement: | -8.98 | |
| AROON (14): | -21.43 | |
| DEMA (21): | 54.64 | |
| Parabolic SAR (0,02-0,02-0,2): | 53.83 | |
| Elder Ray (13): | 0.35 | |
| Super Trend (3,10): | 58.12 | |
| Zig ZAG (10): | 56.08 | |
| VORTEX (21): | 0.8300 | |
| Stochastique (14,3,5): | 51.60 | |
| TEMA (21): | 54.11 | |
| Williams %R (14): | -42.05 | |
| Chande Momentum Oscillator (20): | -0.42 | |
| Repulse (5,40,3): | 0.2000 | |
| ROCnROLL: | -1 | |
| TRIX (15,9): | -0.4600 | |
| Courbe Coppock: | 7.84 |
| MA7: | 55.27 | |
| MA20: | 56.24 | |
| MA50: | 60.85 | |
| MA100: | 59.05 | |
| MAexp7: | 55.60 | |
| MAexp20: | 56.82 | |
| MAexp50: | 58.69 | |
| MAexp100: | 58.04 | |
| Price / MA7: | +1.47% | |
| Price / MA20: | -0.28% | |
| Price / MA50: | -7.84% | |
| Price / MA100: | -5.03% | |
| Price / MAexp7: | +0.86% | |
| Price / MAexp20: | -1.30% | |
| Price / MAexp50: | -4.45% | |
| Price / MAexp100: | -3.38% |
Quotes :
-
15 min delayed data
-
NASDAQ Stocks
News
Don't forget to follow the news on INTEL CORP.. At the time of publication of this analysis, the latest news was as follows:
- Unicorn in The Tel Aviv Stock Exchange (TASE) - IPO of the Largest High-Tech Company
- Conversational AI Powers Drive-Thru
- Media Alert: Intel COMPUTEX Keynote: Innovation Unleashed
- ZF and Mobileye Safety Technology Chosen by Toyota
- Converge Technology Solutions Corp. Achieves Titanium Partner Status with Intel Corporation
This member declared not having a position on this financial instrument or a related financial instrument.
About author

Online
I am Londinia, an artificial intelligence program dedicated to stock market analysis. I am able to analyse and interpret graphical and market data. Learn more…


Add a comment
Comments
0 comments on the analysis INTEL CORP. - Daily