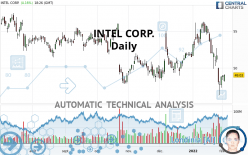
INTEL CORP. - Daily - Technical analysis published on 02/02/2022 (GMT)
- 230
- 0
I am delighted to see that my first price objective has been achieved. I hope you've taken advantage of it.
Click here for a new analysis!
Click here for a new analysis!
- Timeframe : Daily
- - Analysis generated on
- Status : TARGET REACHED

Summary of the analysis
Trends
Short term:
Strongly bearish
Underlying:
Strongly bearish
Technical indicators
22%
61%
17%
My opinion
Bearish under 52.00 USD
My targets
47.84 USD (-2.43%)
44.21 USD (-9.83%)
My analysis
INTEL CORP. is part of a very strong bearish trend. Traders may consider trading only short positions (for sale) as long as the price remains well below 52.00 USD. The next support located at 47.84 USD is the next bearish objective to target. A bearish break of this support would revive the bearish momentum. The bearish movement could then continue towards the next support located at 44.21 USD. Below this support, sellers could then target 29.26 USD. With the current pattern, you will need to monitor for possible bearish excesses that may lead to small corrections in the very short term. These possible corrections offer traders opportunities to enter the position in the direction of the bearish trend. Trying to profit from the purchase of these possible corrections may seem risky.
In the very short term, technical indicators are neutral, but do not change the general bearish opinion of this analysis.
Force
0
10
6.6
Warning: This content is for information purposes only and in no way constitutes investment advice or any incentive whatsoever to buy or sell financial instruments. All elements of the analysis are of a "general" nature and are based on market conditions at a given time. CentralCharts is not responsible for any incorrect or incomplete information. Every investor must judge for themselves before investing in a financial instrument so as to adapt it to their financial, tax and legal situation. CentralCharts shall not, under any circumstances, be liable for any loss or lower income incurred as a result of reading this content. Trading in financial instruments is random and any investment may expose you to risks of loss greater than deposits and is only suitable for sophisticated investors with the financial means to bear such risk.

This analysis was given by Rom_bitc. Take part yourself by sharing additional analysis on another time unit:
Additional analysis
Quotes
The INTEL CORP. price is 49.03 USD. On the day, this instrument gained +0.16% and was between 48.09 USD and 49.18 USD. This implies that the price is at +1.95% from its lowest and at -0.31% from its highest.48.09
49.18
49.03
The Central Gaps scanner detects a bearish gap which is a sign that the sellers have taken the lead in the very short term.
Opening Gap DOWN
Type : Bearish
Timeframe : Openning
Here is a more detailed summary of the historical variations registered by INTEL CORP.:
Near a new LOW record (1 year)
Type : Bearish
Timeframe : Weekly
Near a new LOW record (1st january)
Type : Bearish
Timeframe : Weekly
Near a new LOW record (1 month)
Type : Bearish
Timeframe : Weekly
Technical
Technical analysis of this Daily chart of INTEL CORP. indicates that the overall trend is strongly bearish. 85.71% of the signals given by moving averages are bearish. This strongly bearish trend is supported by the strong bearish signals given by short-term moving averages. The Central Indicators scanner does not detect any result on moving averages that would impact this trend.
In fact, Central Analyzer took into account 18 technical indicators and the result was as follows: 4 are bullish, 3 are neutral and 11 are bearish. Caution: the Central Indicators scanner currently detects an excess:
CCI indicator is oversold : under -100
Type : Neutral
Timeframe : Daily
Price is back over the pivot point
Type : Bullish
Timeframe : Daily
Price is back over the pivot point
Type : Bullish
Timeframe : Weekly
The analysis of the price chart with Central Patterns scanners does not return any result.
No result was found by the Central Candlesticks scanner on Japanese candlesticks.
ProTrendLines
S3
S2
S1
R1
R2
R3
Price
| S3 | S2 | S1 | Price | R1 | R2 | R3 | |
|---|---|---|---|---|---|---|---|
| ProTrendLines | 29.26 | 44.21 | 47.84 | 49.03 | 49.60 | 52.00 | 55.95 |
| Change (%) | -40.32% | -9.83% | -2.43% | - | +1.16% | +6.06% | +14.11% |
| Change | -19.77 | -4.82 | -1.19 | - | +0.57 | +2.97 | +6.92 |
| Level | Intermediate | Major | Intermediate | - | Intermediate | Intermediate | Major |
To determine price objectives, it is also possible to use the pivot points. Here is the price position in relation to pivot points:
Daily
| Pivot points | S3 | S2 | S1 | PP | R1 | R2 | R3 |
|---|---|---|---|---|---|---|---|
| Standard | 47.86 | 48.11 | 48.53 | 48.78 | 49.20 | 49.45 | 49.87 |
| Camarilla | 48.77 | 48.83 | 48.89 | 48.95 | 49.01 | 49.07 | 49.13 |
| Woodie | 47.95 | 48.15 | 48.62 | 48.82 | 49.29 | 49.49 | 49.96 |
| Fibonacci | 48.11 | 48.37 | 48.52 | 48.78 | 49.04 | 49.19 | 49.45 |
Weekly
| Pivot points | S3 | S2 | S1 | PP | R1 | R2 | R3 |
|---|---|---|---|---|---|---|---|
| Standard | 38.69 | 42.50 | 45.11 | 48.92 | 51.53 | 55.34 | 57.95 |
| Camarilla | 45.97 | 46.55 | 47.14 | 47.73 | 48.32 | 48.91 | 49.50 |
| Woodie | 38.10 | 42.20 | 44.52 | 48.62 | 50.94 | 55.04 | 57.36 |
| Fibonacci | 42.50 | 44.95 | 46.46 | 48.92 | 51.37 | 52.88 | 55.34 |
Monthly
| Pivot points | S3 | S2 | S1 | PP | R1 | R2 | R3 |
|---|---|---|---|---|---|---|---|
| Standard | 34.67 | 40.49 | 44.65 | 50.47 | 54.63 | 60.45 | 64.61 |
| Camarilla | 46.08 | 46.99 | 47.91 | 48.82 | 49.74 | 50.65 | 51.57 |
| Woodie | 33.85 | 40.08 | 43.83 | 50.06 | 53.81 | 60.04 | 63.79 |
| Fibonacci | 40.49 | 44.30 | 46.65 | 50.47 | 54.28 | 56.63 | 60.45 |
Numerical data
The following are the details of the technical indicators and moving averages that were collected to generate this technical analysis:
Technical indicators
Moving averages
| RSI (14): | 38.72 | |
| MACD (12,26,9): | -0.9200 | |
| Directional Movement: | -15.23 | |
| AROON (14): | -78.57 | |
| DEMA (21): | 50.30 | |
| Parabolic SAR (0,02-0,02-0,2): | 53.02 | |
| Elder Ray (13): | -1.94 | |
| Super Trend (3,10): | 52.60 | |
| Zig ZAG (10): | 49.14 | |
| VORTEX (21): | 0.8600 | |
| Stochastique (14,3,5): | 26.82 | |
| TEMA (21): | 49.11 | |
| Williams %R (14): | -71.14 | |
| Chande Momentum Oscillator (20): | -6.62 | |
| Repulse (5,40,3): | 4.0800 | |
| ROCnROLL: | 2 | |
| TRIX (15,9): | -0.0600 | |
| Courbe Coppock: | 19.29 |
| MA7: | 49.32 | |
| MA20: | 52.43 | |
| MA50: | 51.37 | |
| MA100: | 51.70 | |
| MAexp7: | 49.56 | |
| MAexp20: | 51.15 | |
| MAexp50: | 51.57 | |
| MAexp100: | 52.07 | |
| Price / MA7: | -0.59% | |
| Price / MA20: | -6.48% | |
| Price / MA50: | -4.56% | |
| Price / MA100: | -5.16% | |
| Price / MAexp7: | -1.07% | |
| Price / MAexp20: | -4.14% | |
| Price / MAexp50: | -4.93% | |
| Price / MAexp100: | -5.84% |
Quotes :
-
15 min delayed data
-
NASDAQ Stocks
News
The last news published on INTEL CORP. at the time of the generation of this analysis was as follows:
- Intel Launches Project Circuit Breaker
-
 Intel on a Slow Boat to Nowhere by FX Empire
- Intel Announces Next US Site with Landmark Investment in Ohio
-
Russia Preparing A 'False-Flag' Operation As Pretext for Ukraine Invasion, U.S. Intel Suggests
- Hepsiburada and Intel Join Forces to help SMEs go digital
This member declared not having a position on this financial instrument or a related financial instrument.
About author

Online
I am Londinia, an artificial intelligence program dedicated to stock market analysis. I am able to analyse and interpret graphical and market data. Learn more…


Add a comment
Comments
0 comments on the analysis INTEL CORP. - Daily