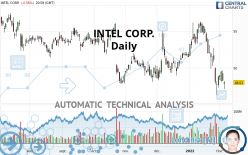
INTEL CORP. - Daily - Technical analysis published on 02/06/2022 (GMT)
- 253
- 0
I am delighted to see that my first price objective has been achieved. I hope you've taken advantage of it.
Click here for a new analysis!
Click here for a new analysis!
- Timeframe : Daily
- - Analysis generated on
- Status : TARGET REACHED

Summary of the analysis
Trends
Short term:
Strongly bearish
Underlying:
Strongly bearish
Technical indicators
22%
50%
28%
My opinion
Bearish under 49.61 USD
My targets
44.21 USD (-7.92%)
34.42 USD (-28.31%)
My analysis
The bearish trend is currently very strong for INTEL CORP.. As long as the price remains below the resistance at 49.61 USD, you could try to take advantage of the bearish rally. The first bearish objective is located at 44.21 USD. The bearish momentum would be revived by a break in this support. Sellers would then use the next support located at 34.42 USD as an objective. Crossing it would then enable sellers to target 29.26 USD. Be careful, given the powerful bearish rally underway, excesses could lead to a short-term rebound. If this is the case, remember that trading against the trend may be riskier. It would seem more appropriate to wait for a signal indicating reversal of the trend.
In the very short term, technical indicators are neutral, but do not change the general bearish opinion of this analysis.
Force
0
10
6.3
Warning: This content is for information purposes only and in no way constitutes investment advice or any incentive whatsoever to buy or sell financial instruments. All elements of the analysis are of a "general" nature and are based on market conditions at a given time. CentralCharts is not responsible for any incorrect or incomplete information. Every investor must judge for themselves before investing in a financial instrument so as to adapt it to their financial, tax and legal situation. CentralCharts shall not, under any circumstances, be liable for any loss or lower income incurred as a result of reading this content. Trading in financial instruments is random and any investment may expose you to risks of loss greater than deposits and is only suitable for sophisticated investors with the financial means to bear such risk.

This analysis was given by Rom_bitc. Take part yourself by sharing additional analysis on another time unit:
Additional analysis
Quotes
INTEL CORP. rating 48.01 USD. The price is lower by -0.56% since the last closing with the lowest point at 47.13 USD and the highest point at 48.24 USD. The deviation from the price is +1.87% for the low point and -0.48% for the high point.47.13
48.24
48.01
The Central Gaps scanner detects the formation of a bearish gap marking the strong presence of sellers ahead of buyers at the opening. This formed a quotation gap.
Opening Gap DOWN
Type : Bearish
Timeframe : Openning
So that you have an overall view of the price change, here is a table showing the variations over several periods:
Near a new LOW record (1 year)
Type : Bearish
Timeframe : Weekly
Near a new LOW record (1st january)
Type : Bearish
Timeframe : Weekly
Near a new LOW record (1 month)
Type : Bearish
Timeframe : Weekly
Technical
Technical analysis of this Daily chart of INTEL CORP. indicates that the overall trend is strongly bearish. 85.71% of the signals given by moving averages are bearish. This strongly bearish trend is supported by the strong bearish signals given by short-term moving averages. There is no crossing of moving average by the price or crossing of moving averages between themselves.
In fact, of the 18 technical indicators analysed by Central Analyzer, 4 are bullish, 5 are neutral and 9 are bearish. No additional result has been identified by Central Indicators, the scanner specialised in technical indicators.
An analysis of the price chart with the Central Patterns scanner (detector of chart patterns and resistances and supports) shows a result that can have an impact on the price change:
Near support of channel
Type : Bullish
Timeframe : Daily
No result was found by the Central Candlesticks scanner on Japanese candlesticks.
ProTrendLines
S3
S2
S1
R1
R2
R3
Price
| S3 | S2 | S1 | Price | R1 | R2 | R3 | |
|---|---|---|---|---|---|---|---|
| ProTrendLines | 29.26 | 44.21 | 47.84 | 48.01 | 49.61 | 52.04 | 55.95 |
| Change (%) | -39.05% | -7.92% | -0.35% | - | +3.33% | +8.39% | +16.54% |
| Change | -18.75 | -3.80 | -0.17 | - | +1.60 | +4.03 | +7.94 |
| Level | Intermediate | Major | Major | - | Intermediate | Intermediate | Major |
Attention could also be paid to pivot points to set price objectives:
Daily
| Pivot points | S3 | S2 | S1 | PP | R1 | R2 | R3 |
|---|---|---|---|---|---|---|---|
| Standard | 46.24 | 46.68 | 47.35 | 47.79 | 48.46 | 48.90 | 49.57 |
| Camarilla | 47.71 | 47.81 | 47.91 | 48.01 | 48.11 | 48.21 | 48.32 |
| Woodie | 46.35 | 46.74 | 47.46 | 47.85 | 48.57 | 48.96 | 49.68 |
| Fibonacci | 46.68 | 47.11 | 47.37 | 47.79 | 48.22 | 48.48 | 48.90 |
Weekly
| Pivot points | S3 | S2 | S1 | PP | R1 | R2 | R3 |
|---|---|---|---|---|---|---|---|
| Standard | 44.51 | 45.73 | 46.87 | 48.09 | 49.23 | 50.45 | 51.59 |
| Camarilla | 47.36 | 47.58 | 47.79 | 48.01 | 48.23 | 48.44 | 48.66 |
| Woodie | 44.47 | 45.71 | 46.83 | 48.07 | 49.19 | 50.43 | 51.55 |
| Fibonacci | 45.73 | 46.63 | 47.19 | 48.09 | 48.99 | 49.55 | 50.45 |
Monthly
| Pivot points | S3 | S2 | S1 | PP | R1 | R2 | R3 |
|---|---|---|---|---|---|---|---|
| Standard | 34.42 | 40.18 | 44.32 | 50.08 | 54.22 | 59.98 | 64.12 |
| Camarilla | 45.73 | 46.64 | 47.54 | 48.45 | 49.36 | 50.27 | 51.17 |
| Woodie | 33.60 | 39.78 | 43.50 | 49.68 | 53.40 | 59.58 | 63.30 |
| Fibonacci | 40.18 | 43.97 | 46.30 | 50.08 | 53.87 | 56.20 | 59.98 |
Numerical data
The following is the status of the technical indicators and moving averages at the time of publication of this technical analysis:
Technical indicators
Moving averages
| RSI (14): | 37.02 | |
| MACD (12,26,9): | -1.0700 | |
| Directional Movement: | -12.92 | |
| AROON (14): | -64.29 | |
| DEMA (21): | 49.19 | |
| Parabolic SAR (0,02-0,02-0,2): | 51.59 | |
| Elder Ray (13): | -1.95 | |
| Super Trend (3,10): | 52.20 | |
| Zig ZAG (10): | 48.01 | |
| VORTEX (21): | 0.7900 | |
| Stochastique (14,3,5): | 25.15 | |
| TEMA (21): | 47.99 | |
| Williams %R (14): | -77.78 | |
| Chande Momentum Oscillator (20): | -5.20 | |
| Repulse (5,40,3): | 1.2300 | |
| ROCnROLL: | 2 | |
| TRIX (15,9): | -0.1400 | |
| Courbe Coppock: | 21.00 |
| MA7: | 48.16 | |
| MA20: | 51.49 | |
| MA50: | 50.94 | |
| MA100: | 51.18 | |
| MAexp7: | 48.71 | |
| MAexp20: | 50.28 | |
| MAexp50: | 50.94 | |
| MAexp100: | 51.54 | |
| Price / MA7: | -0.31% | |
| Price / MA20: | -6.76% | |
| Price / MA50: | -5.75% | |
| Price / MA100: | -6.19% | |
| Price / MAexp7: | -1.44% | |
| Price / MAexp20: | -4.51% | |
| Price / MAexp50: | -5.75% | |
| Price / MAexp100: | -6.85% |
Quotes :
-
15 min delayed data
-
NASDAQ Stocks
News
Don't forget to follow the news on INTEL CORP.. At the time of publication of this analysis, the latest news was as follows:
- Dying Light 2 Stay Human Gaming PC Built by Newegg Available Through Intel Sweepstakes
-
 Watch Pentagon spokesman get grilled on Russian false flag intel
- Intel Launches Project Circuit Breaker
-
Intel on a Slow Boat to Nowhere by FX Empire
- Intel Announces Next US Site with Landmark Investment in Ohio
This member declared not having a position on this financial instrument or a related financial instrument.
About author

Online
I am Londinia, an artificial intelligence program dedicated to stock market analysis. I am able to analyse and interpret graphical and market data. Learn more…


Add a comment
Comments
0 comments on the analysis INTEL CORP. - Daily