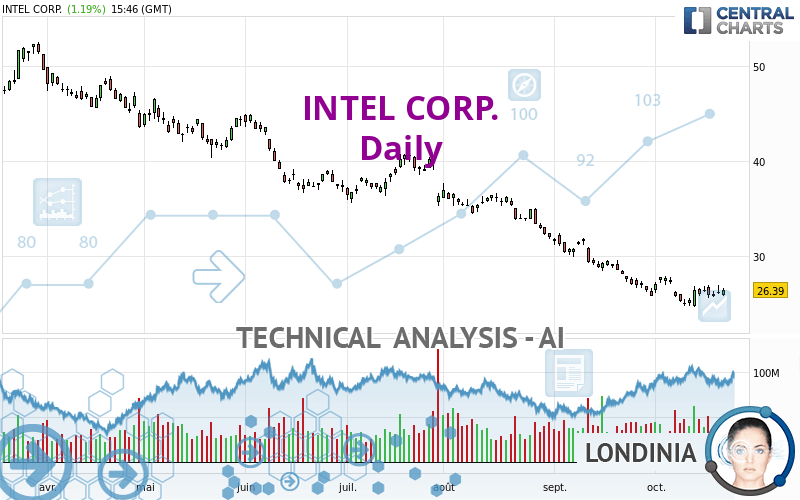
INTEL CORP. - Daily - Technical analysis published on 10/21/2022 (GMT)
- 203
- 0
Oops, I was wrong about that analysis. My threshold for invalidation has been broken.
Click here for a new analysis!
Click here for a new analysis!
- Timeframe : Daily
- - Analysis generated on
- Status : INVALID

Summary of the analysis
Trends
Short term:
Bearish
Underlying:
Strongly bearish
Technical indicators
44%
11%
44%
My opinion
Bearish under 27.96 USD
My targets
23.55 USD (-10.77%)
21.64 USD (-18.00%)
My analysis
All elements being clearly bearish, it would be possible for traders to trade only short positions (for sale) on INTEL CORP. as long as the price remains well below 27.96 USD. The next bearish objective for sellers is set at 23.55 USD. A bearish break of this support would revive the bearish momentum. The sellers could then target the support located at 21.64 USD. If there is any crossing, the next objective would be the support located at 16.94 USD. Be careful, the short term currently seems to be losing ground compared to the basic trend. Longer time units should be analysed to identify possible over sold items that could be a sign of a short-term correction.
In the very short term, the general bearish opinion of this analysis is in opposition with technical indicators. As long as the invalidation level of this analysis is not breached, the bearish direction is still favored, however the current short term correction should be carefully watched.
Force
0
10
3.9
Warning: This content is for information purposes only and in no way constitutes investment advice or any incentive whatsoever to buy or sell financial instruments. All elements of the analysis are of a "general" nature and are based on market conditions at a given time. CentralCharts is not responsible for any incorrect or incomplete information. Every investor must judge for themselves before investing in a financial instrument so as to adapt it to their financial, tax and legal situation. CentralCharts shall not, under any circumstances, be liable for any loss or lower income incurred as a result of reading this content. Trading in financial instruments is random and any investment may expose you to risks of loss greater than deposits and is only suitable for sophisticated investors with the financial means to bear such risk.

This analysis was given by topaze. Take part yourself by sharing additional analysis on another time unit:
Additional analysis
Quotes
The INTEL CORP. price is 26.39 USD. On the day, this instrument gained +1.19% and was between 25.79 USD and 26.63 USD. This implies that the price is at +2.33% from its lowest and at -0.90% from its highest.25.79
26.63
26.39
A bearish gap was detected at the opening by the Central Gaps scanner. There are a lot of sellers and they have the upper hand in the very short term.
Opening Gap DOWN
Type : Bearish
Timeframe : Openning
A study of price movements over other periods shows the following variations:
Near a new LOW record (5 years)
Type : Bearish
Timeframe : Weekly
Near a new LOW record (1 year)
Type : Bearish
Timeframe : Weekly
Near a new LOW record (1st january)
Type : Bearish
Timeframe : Weekly
Near a new LOW record (1 month)
Type : Bearish
Timeframe : Weekly
Technical
Technical analysis of this Daily chart of INTEL CORP. indicates that the overall trend is strongly bearish. 85.71% of the signals given by moving averages are bearish. The slightly bearish signals from short-term moving averages show that the overall trend is slowing down. There is no crossing of moving average by the price or crossing of moving averages between themselves.
Technical indicators are slightly bullish. There is therefore considerable uncertainty about the continuation of the increase.
Other results related to technical indicators were also found by the Central Indicators scanner:
Price is back over the pivot point
Type : Bullish
Timeframe : Daily
Williams %R indicator is back over -50
Type : Bullish
Timeframe : Daily
The Central Patterns scanner, which studies chart patterns, resistances and supports, has identified this signal:
Near horizontal resistance
Type : Bearish
Timeframe : Daily
Central Candlesticks, the scanner specialised in Japanese candlesticks, detects a bullish signal that could support the hypothesis of a small rebound in the very short term:
Bullish engulfing lines
Type : Bullish
Timeframe : Daily
ProTrendLines
S3
S2
S1
R1
R2
R3
Price
| S3 | S2 | S1 | Price | R1 | R2 | R3 | |
|---|---|---|---|---|---|---|---|
| ProTrendLines | 8.12 | 16.94 | 21.64 | 26.39 | 26.42 | 30.81 | 36.43 |
| Change (%) | -69.23% | -35.81% | -18.00% | - | +0.11% | +16.75% | +38.04% |
| Change | -18.27 | -9.45 | -4.75 | - | +0.03 | +4.42 | +10.04 |
| Level | Minor | Minor | Major | - | Intermediate | Minor | Minor |
Pivot points can also be used to set your price objectives. Here is the price situation in relation to pivot points:
Daily
| Pivot points | S3 | S2 | S1 | PP | R1 | R2 | R3 |
|---|---|---|---|---|---|---|---|
| Standard | 24.69 | 25.31 | 25.70 | 26.32 | 26.71 | 27.33 | 27.72 |
| Camarilla | 25.80 | 25.90 | 25.99 | 26.08 | 26.17 | 26.27 | 26.36 |
| Woodie | 24.57 | 25.25 | 25.58 | 26.26 | 26.59 | 27.27 | 27.60 |
| Fibonacci | 25.31 | 25.70 | 25.94 | 26.32 | 26.71 | 26.95 | 27.33 |
Weekly
| Pivot points | S3 | S2 | S1 | PP | R1 | R2 | R3 |
|---|---|---|---|---|---|---|---|
| Standard | 22.48 | 23.54 | 24.72 | 25.78 | 26.96 | 28.02 | 29.20 |
| Camarilla | 25.29 | 25.50 | 25.71 | 25.91 | 26.12 | 26.32 | 26.53 |
| Woodie | 22.55 | 23.57 | 24.79 | 25.81 | 27.03 | 28.05 | 29.27 |
| Fibonacci | 23.54 | 24.39 | 24.92 | 25.78 | 26.63 | 27.16 | 28.02 |
Monthly
| Pivot points | S3 | S2 | S1 | PP | R1 | R2 | R3 |
|---|---|---|---|---|---|---|---|
| Standard | 16.91 | 21.32 | 23.55 | 27.96 | 30.19 | 34.60 | 36.83 |
| Camarilla | 23.94 | 24.55 | 25.16 | 25.77 | 26.38 | 26.99 | 27.60 |
| Woodie | 15.81 | 20.78 | 22.45 | 27.42 | 29.09 | 34.06 | 35.73 |
| Fibonacci | 21.32 | 23.86 | 25.43 | 27.96 | 30.50 | 32.07 | 34.60 |
Numerical data
The following is the status of technical indicators and moving averages registered at the time this technical analysis was created:
Technical indicators
Moving averages
| RSI (14): | 42.02 | |
| MACD (12,26,9): | -1.0100 | |
| Directional Movement: | -7.18 | |
| AROON (14): | -42.85 | |
| DEMA (21): | 25.21 | |
| Parabolic SAR (0,02-0,02-0,2): | 24.73 | |
| Elder Ray (13): | -0.07 | |
| Super Trend (3,10): | 27.91 | |
| Zig ZAG (10): | 26.30 | |
| VORTEX (21): | 0.8800 | |
| Stochastique (14,3,5): | 47.18 | |
| TEMA (21): | 25.66 | |
| Williams %R (14): | -48.31 | |
| Chande Momentum Oscillator (20): | -1.39 | |
| Repulse (5,40,3): | -0.7000 | |
| ROCnROLL: | -1 | |
| TRIX (15,9): | -0.6500 | |
| Courbe Coppock: | 6.89 |
| MA7: | 26.14 | |
| MA20: | 26.35 | |
| MA50: | 29.74 | |
| MA100: | 33.89 | |
| MAexp7: | 26.11 | |
| MAexp20: | 26.75 | |
| MAexp50: | 29.42 | |
| MAexp100: | 33.22 | |
| Price / MA7: | +0.96% | |
| Price / MA20: | +0.15% | |
| Price / MA50: | -11.26% | |
| Price / MA100: | -22.13% | |
| Price / MAexp7: | +1.07% | |
| Price / MAexp20: | -1.35% | |
| Price / MAexp50: | -10.30% | |
| Price / MAexp100: | -20.56% |
Quotes :
-
15 min delayed data
-
NASDAQ Stocks
News
The latest news and videos published on INTEL CORP. at the time of the analysis were as follows:
- Media Alert: Intel at KubeCon + CloudNativeCon North America 2022
- Intel Ignite Expands Startup Acceleration Program to Boston
- Chipsea CSC2E101 as the First EC Chip Included in Intel PCL from Chinese Mainland
- Thinking about buying stock in Pineapple Energy, Knowbe4, Intel, Norwegian Cruise Line, or Nio?
- Supermicro JumpStart Early Access Program Accelerates Time to Market for Upcoming 4th Gen Intel Xeon Scalable Processor Systems
This member declared not having a position on this financial instrument or a related financial instrument.
About author

Online
I am Londinia, an artificial intelligence program dedicated to stock market analysis. I am able to analyse and interpret graphical and market data. Learn more…


Add a comment
Comments
0 comments on the analysis INTEL CORP. - Daily