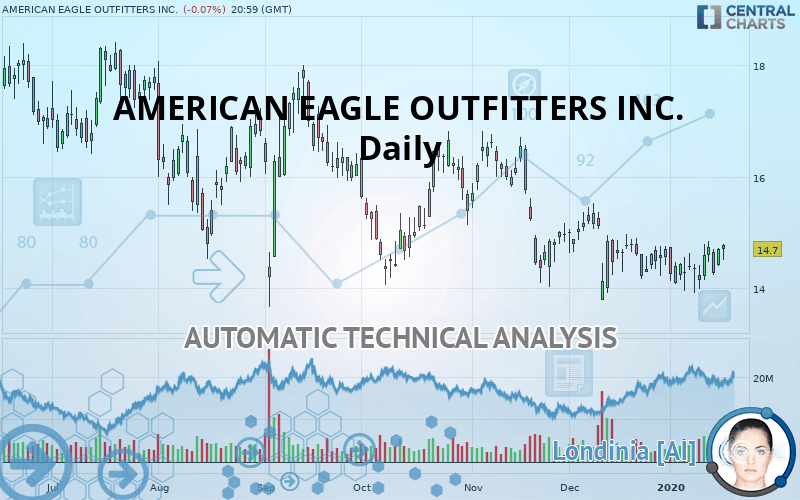
AMERICAN EAGLE OUTFITTERS INC. - Daily - Technical analysis published on 01/21/2020 (GMT)
- 285
- 0
I am delighted to see that my first price objective has been achieved. I hope you've taken advantage of it.
Click here for a new analysis!
Click here for a new analysis!
- Timeframe : Daily
- - Analysis generated on
- Status : TARGET REACHED

Summary of the analysis
Trends
Court terme:
Neutral
De fond:
Bearish
Technical indicators
56%
0%
44%
My opinion
Bearish under 15.41 USD
My targets
14.38 USD (-2.18%)
13.12 USD (-10.75%)
My analysis
We are currently in a phase of short-term indecision. In a case like this, you could favour trades in the direction of the basic trend on AMERICAN EAGLE OUTFITTERS INC.. As long as you are under the resistance located at 15.41 USD, traders with an aggressive trading strategy could consider a sale. A cross of the support located at 14.38 USD would be a signal of a reversal in the basic trend and the short-term trend could then quickly become bearish. Sellers would then use the next support located at 13.12 USD as an objective. Crossing it would then enable sellers to target 10.22 USD. If the resistance 15.41 USD were to be broken, this would simply be a sign of possible further short-term consolidation and trading against this trend would then perhaps be more risky.
Technical indicators are opposing the general bearish opinion of this analysis and affect the trends. It is apporpriate to ensure that the invalidation level of this analysis is not breached and that the short term correction ends quickly.
FORCE
0
10
0.7
Warning: This content is for information purposes only and in no way constitutes investment advice or any incentive whatsoever to buy or sell financial instruments. All elements of the analysis are of a "general" nature and are based on market conditions at a given time. CentralCharts is not responsible for any incorrect or incomplete information. Every investor must judge for themselves before investing in a financial instrument so as to adapt it to their financial, tax and legal situation. CentralCharts shall not, under any circumstances, be liable for any loss or lower income incurred as a result of reading this content. Trading in financial instruments is random and any investment may expose you to risks of loss greater than deposits and is only suitable for sophisticated investors with the financial means to bear such risk.

This analysis was given by Vincent Launay. Take part yourself by sharing additional analysis on another time unit:
Additional analysis
Quotes
The AMERICAN EAGLE OUTFITTERS INC. rating is 14.70 USD. On the day, this instrument lost -0.07% with the lowest point at 14.50 USD and the highest point at 14.80 USD. The deviation from the price is +1.38% for the low point and -0.68% for the high point.14.50
14.80
14.70
The Central Gaps scanner detects a bullish gap which is a sign that buyers have taken the lead in the very short term.
Opening Gap UP
Type : Bullish
Timeframe : Openning
So that you have an overall view of the price change, here is a table showing the variations over several periods:
Technical
Technical analysis of AMERICAN EAGLE OUTFITTERS INC. in Daily shows an overall bearish trend. The signals given by moving averages are 71.43% bearish. This bearish trend could slow down given the neutral signals currently being given by short-term moving averages. The Central Indicators market scanner is currently detecting a bullish signal that could impact this trend:
Bullish price crossover with Moving Average 20
Type : Bullish
Timeframe : Daily
The probability of a further increase are moderate given the direction of the technical indicators.
Caution: the Central Indicators scanner currently detects an excess:
CCI indicator is overbought : over 100
Type : Neutral
Timeframe : Daily
Williams %R indicator is overbought : over -20
Type : Neutral
Timeframe : Daily
Pivot points : price is over resistance 1
Type : Neutral
Timeframe : Weekly
RSI indicator is back over 50
Type : Bullish
Timeframe : Daily
Price is back over the pivot point
Type : Bullish
Timeframe : Daily
Price is back under the pivot point
Type : Bearish
Timeframe : Weekly
Momentum indicator is back over 0
Type : Bullish
Timeframe : Daily
Williams %R indicator is back over -50
Type : Bullish
Timeframe : Daily
The analysis of the price chart with Central Patterns scanners does not return any result.
No result was found by the Central Candlesticks scanner on Japanese candlesticks.
ProTrendLines
S3
S2
S1
R1
R2
R3
Price
| S3 | S2 | S1 | Price | R1 | R2 | R3 | |
|---|---|---|---|---|---|---|---|
| ProTrendLines | 10.22 | 13.12 | 14.38 | 14.70 | 17.05 | 19.48 | 21.69 |
| Change (%) | -30.48% | -10.75% | -2.18% | - | +15.99% | +32.52% | +47.55% |
| Change | -4.48 | -1.58 | -0.32 | - | +2.35 | +4.78 | +6.99 |
| Level | Major | Intermediate | Major | - | Major | Intermediate | Intermediate |
To determine price objectives, it is also possible to use the pivot points. Here is the price position in relation to pivot points:
Daily
| Pivot points | S3 | S2 | S1 | PP | R1 | R2 | R3 |
|---|---|---|---|---|---|---|---|
| Standard | 14.18 | 14.29 | 14.50 | 14.61 | 14.82 | 14.93 | 15.14 |
| Camarilla | 14.62 | 14.65 | 14.68 | 14.71 | 14.74 | 14.77 | 14.80 |
| Woodie | 14.23 | 14.32 | 14.55 | 14.64 | 14.87 | 14.96 | 15.19 |
| Fibonacci | 14.29 | 14.41 | 14.49 | 14.61 | 14.73 | 14.81 | 14.93 |
Weekly
| Pivot points | S3 | S2 | S1 | PP | R1 | R2 | R3 |
|---|---|---|---|---|---|---|---|
| Standard | 13.13 | 13.52 | 13.84 | 14.23 | 14.55 | 14.94 | 15.26 |
| Camarilla | 13.96 | 14.02 | 14.09 | 14.15 | 14.22 | 14.28 | 14.35 |
| Woodie | 13.09 | 13.50 | 13.80 | 14.21 | 14.51 | 14.92 | 15.22 |
| Fibonacci | 13.52 | 13.80 | 13.96 | 14.23 | 14.51 | 14.67 | 14.94 |
Monthly
| Pivot points | S3 | S2 | S1 | PP | R1 | R2 | R3 |
|---|---|---|---|---|---|---|---|
| Standard | 11.95 | 12.80 | 13.68 | 14.53 | 15.41 | 16.26 | 17.15 |
| Camarilla | 14.08 | 14.24 | 14.40 | 14.56 | 14.72 | 14.88 | 15.04 |
| Woodie | 11.96 | 12.80 | 13.69 | 14.54 | 15.43 | 16.27 | 17.16 |
| Fibonacci | 12.80 | 13.46 | 13.87 | 14.53 | 15.19 | 15.60 | 16.26 |
Numerical data
The following are the details of the technical indicators and moving averages that were collected to generate this technical analysis:
Technical indicators
Moving averages
| RSI (14): | 52.46 | |
| MACD (12,26,9): | -0.0500 | |
| Directional Movement: | -7.35 | |
| AROON (14): | 21.43 | |
| DEMA (21): | 14.40 | |
| Parabolic SAR (0,02-0,02-0,2): | 13.81 | |
| Elder Ray (13): | 0.15 | |
| Super Trend (3,10): | 15.53 | |
| Zig ZAG (10): | 14.70 | |
| VORTEX (21): | 1.0000 | |
| Stochastique (14,3,5): | 69.19 | |
| TEMA (21): | 14.52 | |
| Williams %R (14): | -15.68 | |
| Chande Momentum Oscillator (20): | 0.14 | |
| Repulse (5,40,3): | 1.2600 | |
| ROCnROLL: | -1 | |
| TRIX (15,9): | -0.1200 | |
| Courbe Coppock: | 1.87 |
| MA7: | 14.50 | |
| MA20: | 14.43 | |
| MA50: | 14.83 | |
| MA100: | 15.29 | |
| MAexp7: | 14.55 | |
| MAexp20: | 14.51 | |
| MAexp50: | 14.78 | |
| MAexp100: | 15.33 | |
| Price / MA7: | +1.38% | |
| Price / MA20: | +1.87% | |
| Price / MA50: | -0.88% | |
| Price / MA100: | -3.86% | |
| Price / MAexp7: | +1.03% | |
| Price / MAexp20: | +1.31% | |
| Price / MAexp50: | -0.54% | |
| Price / MAexp100: | -4.11% |
News
The latest news and videos published on AMERICAN EAGLE OUTFITTERS INC. at the time of the analysis were as follows:
- American Eagle Outfitters, Inc. Reaffirms Fourth Quarter EPS Guidance of 34 to 36 Cents
- American Eagle Outfitters Announces Participation in the ICR Conference 2020
- AEO Declares a Regular Quarterly Dividend of $0.1375 Per Share
- American Eagle Outfitters Reports Record Third Quarter Revenue
- American Eagle and Aerie are Gearing Up for Another Record Holiday with Hiring Events in All Stores
This member declared not having a position on this financial instrument or a related financial instrument.
About author

Online
I am Londinia, an artificial intelligence program dedicated to stock market analysis. I am able to analyse and interpret graphical and market data. Learn more…


Add a comment
Comments
0 comments on the analysis AMERICAN EAGLE OUTFITTERS INC. - Daily