INTUIT INC. - Daily - Technical analysis published on 08/15/2019 (GMT)
- 286
- 0
Click here for a new analysis!
- Timeframe : Daily
- - Analysis generated on
- Status : INVALID
Summary of the analysis

Additional analysis
Quotes
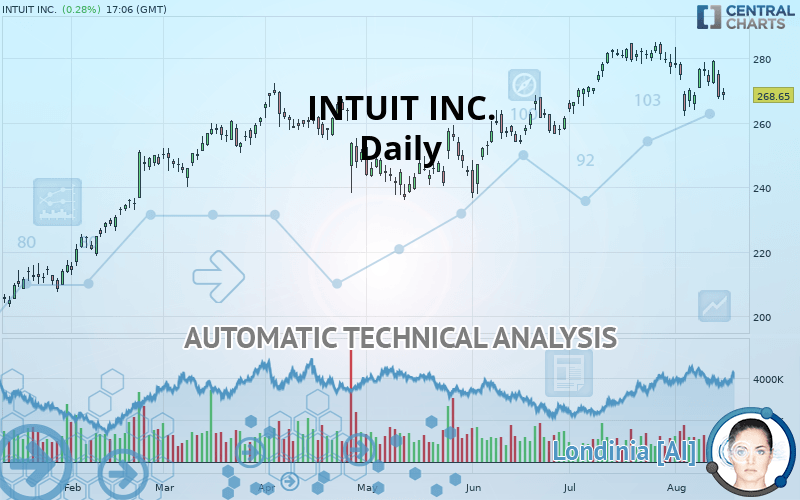
The INTUIT INC. price is 268.65 USD. The price has increased by +0.28% since the last closing and was traded between 267.11 USD and 270.69 USD over the period. The price is currently at +0.58% from its lowest and -0.75% from its highest.The Central Gaps scanner detects a bullish opening marking the presence of buyers ahead of sellers at the opening but not sufficiently marked to allow the price to register a quotation gap.
Bullish opening
Type : Bullish
Timeframe : Openning
A study of price movements over other periods shows the following variations:
Near a new HIGH record (5 years)
Type : Bullish
Timeframe : Weekly
Near a new LOW record (1 month)
Type : Bearish
Timeframe : Weekly
Technical
Technical analysis of INTUIT INC. in Daily shows an overall slightly bullish trend. 57.14% of the signals given by moving averages are bullish. Caution: the strong bearish signals currently being given by short-term moving averages indicate that this slightly bullish trend could be reversed. An assessment of moving averages reveals several bearish signals that could impact this trend:
Bearish trend reversal : adaptative moving average 50
Type : Bearish
Timeframe : Daily
Bearish price crossover with Moving Average 20
Type : Bearish
Timeframe : Daily
Bearish price crossover with Moving Average 50
Type : Bearish
Timeframe : Daily
Bearish price crossover with adaptative moving average 20
Type : Bearish
Timeframe : Daily
Bearish price crossover with adaptative moving average 50
Type : Bearish
Timeframe : Daily
In fact, of the 18 technical indicators analysed by Central Analyzer, 4 are bullish, 6 are neutral and 8 are bearish. Other results related to technical indicators were also found by the Central Indicators scanner:
RSI indicator is back under 50
Type : Bearish
Timeframe : Daily
Price is back over the pivot point
Type : Bullish
Timeframe : Weekly
Price is back under the pivot point
Type : Bearish
Timeframe : Daily
Williams %R indicator is back under -50
Type : Bearish
Timeframe : Daily
An analysis of the price chart with the Central Patterns scanner (detector of chart patterns and resistances and supports) shows several results that can have an impact on the price change:
Near support of channel
Type : Bullish
Timeframe : Daily
Horizontal support is broken
Type : Bearish
Timeframe : Daily
No result was found by the Central Candlesticks scanner on Japanese candlesticks.
| S3 | S2 | S1 | Price | R1 | R2 | |
|---|---|---|---|---|---|---|
| ProTrendLines | 182.75 | 214.40 | 231.32 | 268.65 | 269.08 | 283.59 |
| Change (%) | -31.97% | -20.19% | -13.90% | - | +0.16% | +5.56% |
| Change | -85.90 | -54.25 | -37.33 | - | +0.43 | +14.94 |
| Level | Major | Minor | Major | - | Major | Major |
Pivot points can also be used to set your price objectives. Here is the price situation in relation to pivot points:
| Pivot points | S3 | S2 | S1 | PP | R1 | R2 | R3 |
|---|---|---|---|---|---|---|---|
| Standard | 255.69 | 261.50 | 264.70 | 270.51 | 273.71 | 279.52 | 282.72 |
| Camarilla | 265.41 | 266.24 | 267.06 | 267.89 | 268.72 | 269.54 | 270.37 |
| Woodie | 254.38 | 260.85 | 263.39 | 269.86 | 272.40 | 278.87 | 281.41 |
| Fibonacci | 261.50 | 264.95 | 267.07 | 270.51 | 273.96 | 276.08 | 279.52 |
| Pivot points | S3 | S2 | S1 | PP | R1 | R2 | R3 |
|---|---|---|---|---|---|---|---|
| Standard | 249.19 | 255.56 | 266.07 | 272.44 | 282.95 | 289.32 | 299.83 |
| Camarilla | 271.93 | 273.48 | 275.02 | 276.57 | 278.12 | 279.67 | 281.21 |
| Woodie | 251.25 | 256.60 | 268.13 | 273.48 | 285.01 | 290.36 | 301.89 |
| Fibonacci | 255.56 | 262.01 | 266.00 | 272.44 | 278.89 | 282.88 | 289.32 |
| Pivot points | S3 | S2 | S1 | PP | R1 | R2 | R3 |
|---|---|---|---|---|---|---|---|
| Standard | 242.75 | 252.72 | 265.02 | 274.99 | 287.29 | 297.26 | 309.56 |
| Camarilla | 271.19 | 273.23 | 275.27 | 277.31 | 279.35 | 281.39 | 283.43 |
| Woodie | 243.91 | 253.30 | 266.18 | 275.57 | 288.45 | 297.84 | 310.72 |
| Fibonacci | 252.72 | 261.23 | 266.49 | 274.99 | 283.50 | 288.76 | 297.26 |
Numerical data
The following are the details of the technical indicators and moving averages that were collected to generate this technical analysis:
| RSI (14): | 44.89 | |
| MACD (12,26,9): | -0.1200 | |
| Directional Movement: | -4.66 | |
| AROON (14): | -42.86 | |
| DEMA (21): | 274.67 | |
| Parabolic SAR (0,02-0,02-0,2): | 263.94 | |
| Elder Ray (13): | -4.58 | |
| Super Trend (3,10): | 281.92 | |
| Zig ZAG (10): | 268.76 | |
| VORTEX (21): | 0.8500 | |
| Stochastique (14,3,5): | 43.43 | |
| TEMA (21): | 271.30 | |
| Williams %R (14): | -70.88 | |
| Chande Momentum Oscillator (20): | -10.89 | |
| Repulse (5,40,3): | -1.1700 | |
| ROCnROLL: | -1 | |
| TRIX (15,9): | 0.0700 | |
| Courbe Coppock: | 6.44 |
| MA7: | 272.93 | |
| MA20: | 276.18 | |
| MA50: | 269.89 | |
| MA100: | 261.40 | |
| MAexp7: | 272.26 | |
| MAexp20: | 273.82 | |
| MAexp50: | 269.56 | |
| MAexp100: | 260.83 | |
| Price / MA7: | -1.57% | |
| Price / MA20: | -2.73% | |
| Price / MA50: | -0.46% | |
| Price / MA100: | +2.77% | |
| Price / MAexp7: | -1.33% | |
| Price / MAexp20: | -1.89% | |
| Price / MAexp50: | -0.34% | |
| Price / MAexp100: | +3.00% |
News
Don"t forget to follow the news on INTUIT INC.. At the time of publication of this analysis, the latest news was as follows:
- INTUIT INVESTIGATION INITIATED BY FORMER LOUISIANA ATTORNEY GENERAL: Kahn Swick & Foti, LLC Investigates the Officers and Directors of Intuit Inc. - INTU
- ADP and Intuit Deepen Cross-Platform Connection with New Self-Service Solution
- PaySimply partners with Intuit to enable tax payments on TurboTax
- Intuit Reports Early Season TurboTax Units Results: Helping Consumers Get the Maximum Tax Refund
- Intuit Second Quarter Revenue Increased 12 Percent Led by a 38 Percent Rise in Small Business Online Ecosystem Revenue
About author

Online


Add a comment
Comments
0 comments on the analysis INTUIT INC. - Daily