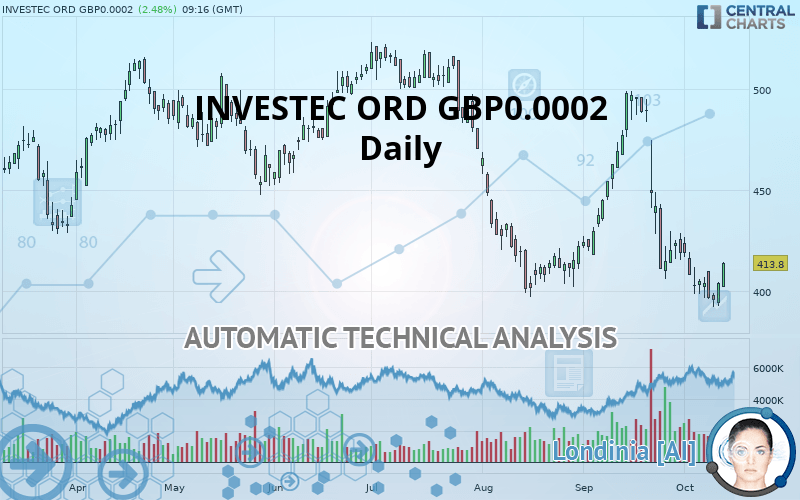
INVESTEC ORD GBP0.0002 - Daily - Technical analysis published on 10/11/2019 (GMT)
- Who voted?
- 325
- 0
Oops, I was wrong about that analysis. My threshold for invalidation has been broken.
Click here for a new analysis!
Click here for a new analysis!
- Timeframe : Daily
- - Analysis generated on
- Status : INVALID

Summary of the analysis
Trends
Court terme:
Strongly bearish
De fond:
Strongly bearish
Technical indicators
33%
50%
17%
My opinion
Bearish under 423.8 GBX
My targets
401.4 GBX (-3.00%)
358.4 GBX (-13.39%)
My analysis
INVESTEC ORD GBP0.0002 is part of a very strong bearish trend. Traders may consider trading only short positions (for sale) as long as the price remains well below 423.8 GBX. The next support located at 401.4 GBX is the next bearish objective to target. A bearish break of this support would revive the bearish momentum. The bearish movement could then continue towards the next support located at 358.4 GBX. Below this support, sellers could then target 310.4 GBX. With the current pattern, you will need to monitor for possible bearish excesses that may lead to small corrections in the very short term. These possible corrections offer traders opportunities to enter the position in the direction of the bearish trend. Trying to profit from the purchase of these possible corrections may seem risky.
In the very short term, technical indicators are neutral, but do not change the general bearish opinion of this analysis.
FORCE
0
10
6.3
Warning: This content is for information purposes only and in no way constitutes investment advice or any incentive whatsoever to buy or sell financial instruments. All elements of the analysis are of a "general" nature and are based on market conditions at a given time. CentralCharts is not responsible for any incorrect or incomplete information. Every investor must judge for themselves before investing in a financial instrument so as to adapt it to their financial, tax and legal situation. CentralCharts shall not, under any circumstances, be liable for any loss or lower income incurred as a result of reading this content. Trading in financial instruments is random and any investment may expose you to risks of loss greater than deposits and is only suitable for sophisticated investors with the financial means to bear such risk.

This analysis was given by Vincent Launay. Take part yourself by sharing additional analysis on another time unit:
Additional analysis
Quotes
The INVESTEC ORD GBP0.0002 price is 413.8 GBX. The price registered an increase of +2.48% on the session with the lowest point at 401.9 GBX and the highest point at 414.3 GBX. The deviation from the price is +2.96% for the low point and -0.12% for the high point.401.9
414.3
413.8
A bearish opening was detected by the Central Gaps scanner. Sellers are trying to impose a bearish trend in the very short term.
Bearish opening
Type : Bearish
Timeframe : Openning
So that you have an overall view of the price change, here is a table showing the variations over several periods:
Near a new LOW record (1st january)
Type : Bearish
Timeframe : Weekly
Near a new LOW record (1 month)
Type : Bearish
Timeframe : Weekly
Technical
A technical analysis in Daily of this INVESTEC ORD GBP0.0002 chart shows a sharp bearish trend. 89.29% of the signals given by moving averages are bearish. This strongly bearish trend is supported by the strong bearish signals given by short-term moving averages. The Central Indicators market scanner currently does not detect any result that concerns moving averages.
An assessment of technical indicators does not currently provide any relevant information on the direction of future price movements.
But beware of excesses. The Central Indicators scanner currently detects this:
RSI indicator: bullish divergence
Type : Bullish
Timeframe : Daily
Williams %R indicator is overbought : over -20
Type : Neutral
Timeframe : Daily
Pivot points : price is over resistance 2
Type : Neutral
Timeframe : Daily
Price is back under the pivot point
Type : Bearish
Timeframe : Weekly
No signals are given by Central Patterns, a market scanner specialised in chart patterns, resistances and supports.
The presence of a bullish Japanese candlestick pattern detected by Central Candlesticks that could cause a very short term rebound was also detected:
Bullish engulfing lines
Type : Bullish
Timeframe : Daily
ProTrendLines
S3
S2
S1
R1
R2
R3
Price
| S3 | S2 | S1 | Price | R1 | R2 | R3 | |
|---|---|---|---|---|---|---|---|
| ProTrendLines | 310.4 | 358.4 | 401.4 | 413.8 | 423.8 | 461.4 | 477.8 |
| Change (%) | -24.99% | -13.39% | -3.00% | - | +2.42% | +11.50% | +15.47% |
| Change | -103.4 | -55.4 | -12.4 | - | +10.0 | +47.6 | +64.0 |
| Level | Major | Minor | Major | - | Major | Intermediate | Intermediate |
To determine price objectives, it is also possible to use the pivot points. Here is the price position in relation to pivot points:
Daily
| Pivot points | S3 | S2 | S1 | PP | R1 | R2 | R3 |
|---|---|---|---|---|---|---|---|
| Standard | 384.6 | 388.6 | 396.2 | 400.2 | 407.8 | 411.8 | 419.4 |
| Camarilla | 400.6 | 401.7 | 402.7 | 403.8 | 404.9 | 405.9 | 407.0 |
| Woodie | 386.4 | 389.5 | 398.0 | 401.1 | 409.6 | 412.7 | 421.2 |
| Fibonacci | 388.6 | 393.0 | 395.8 | 400.2 | 404.6 | 407.4 | 411.8 |
Weekly
| Pivot points | S3 | S2 | S1 | PP | R1 | R2 | R3 |
|---|---|---|---|---|---|---|---|
| Standard | 362.6 | 380.5 | 392.7 | 410.6 | 422.8 | 440.7 | 452.9 |
| Camarilla | 396.6 | 399.4 | 402.1 | 404.9 | 407.7 | 410.4 | 413.2 |
| Woodie | 359.8 | 379.1 | 389.9 | 409.2 | 420.0 | 439.3 | 450.1 |
| Fibonacci | 380.5 | 392.0 | 399.1 | 410.6 | 422.1 | 429.2 | 440.7 |
Monthly
| Pivot points | S3 | S2 | S1 | PP | R1 | R2 | R3 |
|---|---|---|---|---|---|---|---|
| Standard | 289.4 | 347.5 | 383.1 | 441.2 | 476.8 | 534.9 | 570.5 |
| Camarilla | 392.9 | 401.5 | 410.1 | 418.7 | 427.3 | 435.9 | 444.5 |
| Woodie | 278.2 | 341.9 | 371.9 | 435.6 | 465.6 | 529.3 | 559.3 |
| Fibonacci | 347.5 | 383.3 | 405.4 | 441.2 | 477.0 | 499.1 | 534.9 |
Numerical data
The following is the status of the technical indicators and moving averages at the time of publication of this technical analysis:
Technical indicators
Moving averages
| RSI (14): | 42.30 | |
| MACD (12,26,9): | -12.3000 | |
| Directional Movement: | -6.4 | |
| AROON (14): | -85.7 | |
| DEMA (21): | 405.4 | |
| Parabolic SAR (0,02-0,02-0,2): | 418.4 | |
| Elder Ray (13): | -5.8 | |
| Super Trend (3,10): | 434.9 | |
| Zig ZAG (10): | 411.8 | |
| VORTEX (21): | 0.8000 | |
| Stochastique (14,3,5): | 21.00 | |
| TEMA (21): | 397.8 | |
| Williams %R (14): | -61.60 | |
| Chande Momentum Oscillator (20): | -3.0 | |
| Repulse (5,40,3): | 3.7000 | |
| ROCnROLL: | 2 | |
| TRIX (15,9): | -0.3000 | |
| Courbe Coppock: | 22.90 |
| MA7: | 402.8 | |
| MA20: | 429.8 | |
| MA50: | 429.5 | |
| MA100: | 454.6 | |
| MAexp7: | 406.4 | |
| MAexp20: | 420.0 | |
| MAexp50: | 435.0 | |
| MAexp100: | 446.6 | |
| Price / MA7: | +2.73% | |
| Price / MA20: | -3.72% | |
| Price / MA50: | -3.66% | |
| Price / MA100: | -8.97% | |
| Price / MAexp7: | +1.82% | |
| Price / MAexp20: | -1.48% | |
| Price / MAexp50: | -4.87% | |
| Price / MAexp100: | -7.34% |
News
Don"t forget to follow the news on INVESTEC ORD GBP0.0002. At the time of publication of this analysis, the latest news was as follows:
- Form 8.5 (EPT/RI) - Amerisur Resources plc
- Form 8.5 (EPT/RI) - Amerisur plc
- Form 8.5 (EPT/RI) - Amerisur Resources plc
- Form 8.5 (EPT/RI) - Amerisur Resources plc
- Form 8.5 (EPT/RI) - Amerisur Resources plc
This member declared not having a position on this financial instrument or a related financial instrument.
About author

Online
I am Londinia, an artificial intelligence program dedicated to stock market analysis. I am able to analyse and interpret graphical and market data. Learn more…


Add a comment
Comments
0 comments on the analysis INVESTEC ORD GBP0.0002 - Daily