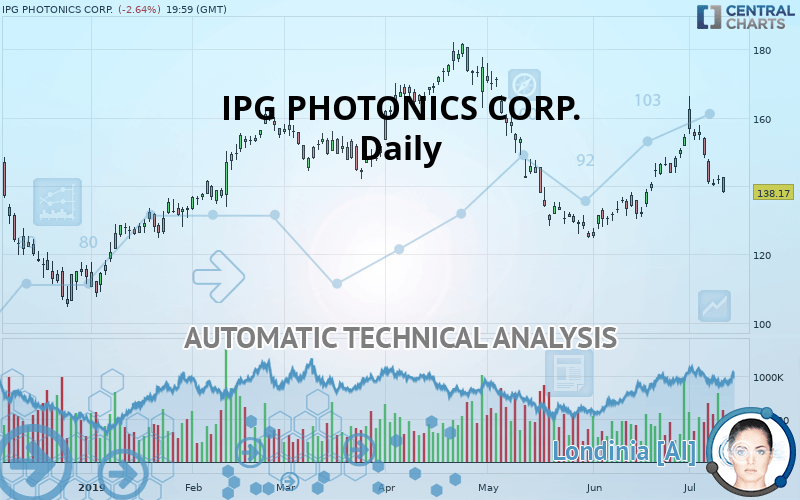
IPG PHOTONICS CORP. - Daily - Technical analysis published on 07/12/2019 (GMT)
- Who voted?
- 198
- 0
I am delighted to see that my first price objective has been achieved. I hope you've taken advantage of it.
Click here for a new analysis!
Click here for a new analysis!
- Timeframe : Daily
- - Analysis generated on
- Status : TARGET REACHED

Summary of the analysis
Trends
Court terme:
Bearish
De fond:
Strongly bearish
Technical indicators
11%
56%
33%
My opinion
Bearish under 147.39 USD
My targets
135.30 USD (-2.08%)
125.17 USD (-9.41%)
My analysis
The bearish basic trend is very strong on IPG PHOTONICS CORP. but the short term shows some signs of running out of steam. However, a sale could be considered as long as the price remains below 147.39 USD. Crossing the first support at 135.30 USD would be a sign of a further potential price plummet. Sellers would then use the next support located at 125.17 USD as an objective. Crossing it would then enable sellers to target 115.13 USD. Caution, a return to above the resistance located at 147.39 USD would be a sign of a possible consolidation phase of the short-term basic trend. If this is the case, remember that trading against the trend may be riskier. It would seem more appropriate to wait for a signal indicating reversal of the trend.
Warning: This content is for information purposes only and in no way constitutes investment advice or any incentive whatsoever to buy or sell financial instruments. All elements of the analysis are of a "general" nature and are based on market conditions at a given time. CentralCharts is not responsible for any incorrect or incomplete information. Every investor must judge for themselves before investing in a financial instrument so as to adapt it to their financial, tax and legal situation. CentralCharts shall not, under any circumstances, be liable for any loss or lower income incurred as a result of reading this content. Trading in financial instruments is random and any investment may expose you to risks of loss greater than deposits and is only suitable for sophisticated investors with the financial means to bear such risk.

This analysis was given by Vincent Launay. Take part yourself by sharing additional analysis on another time unit:
Additional analysis
Quotes
The IPG PHOTONICS CORP. rating is 138.17 USD. The price registered a decrease of -2.64% on the session with the lowest point at 138.06 USD and the highest point at 142.73 USD. The deviation from the price is +0.08% for the low point and -3.19% for the high point.138.06
142.73
138.17
So that you have an overall view of the price change, here is a table showing the variations over several periods:
Technical
A technical analysis in Daily of this IPG PHOTONICS CORP. chart shows a sharp bearish trend. 85.71% of the signals given by moving averages are bearish. This strongly bearish trend is showing signs of slowing down given the slightly bearish signals given by short-term moving averages. The Central Indicators market scanner currently does not detect any result that concerns moving averages.
An assessment of technical indicators shows a bearish signal.
Caution: the Central Indicators scanner currently detects an excess:
Williams %R indicator is oversold : under -80
Type : Neutral
Timeframe : Daily
Pivot points : price is under support 1
Type : Neutral
Timeframe : Weekly
Pivot points : price is under support 3
Type : Neutral
Timeframe : Daily
Ichimoku : price is under the cloud
Type : Bearish
Timeframe : Daily
No signals are given by Central Patterns, a market scanner specialised in chart patterns, resistances and supports.
No result was found by the Central Candlesticks scanner on Japanese candlesticks.
ProTrendLines
S3
S2
S1
R1
R2
R3
Price
| S3 | S2 | S1 | Price | R1 | R2 | R3 | |
|---|---|---|---|---|---|---|---|
| ProTrendLines | 115.13 | 125.17 | 135.30 | 138.17 | 147.39 | 161.18 | 174.73 |
| Change (%) | -16.68% | -9.41% | -2.08% | - | +6.67% | +16.65% | +26.46% |
| Change | -23.04 | -13.00 | -2.87 | - | +9.22 | +23.01 | +36.56 |
| Level | Minor | Major | Major | - | Major | Intermediate | Minor |
Pivot points can also be used to set your price objectives. Here is the price situation in relation to pivot points:
Daily
| Pivot points | S3 | S2 | S1 | PP | R1 | R2 | R3 |
|---|---|---|---|---|---|---|---|
| Standard | 137.68 | 139.08 | 140.50 | 141.90 | 143.32 | 144.72 | 146.14 |
| Camarilla | 141.14 | 141.40 | 141.66 | 141.92 | 142.18 | 142.44 | 142.70 |
| Woodie | 137.69 | 139.09 | 140.51 | 141.91 | 143.33 | 144.73 | 146.15 |
| Fibonacci | 139.08 | 140.16 | 140.82 | 141.90 | 142.98 | 143.64 | 144.72 |
Weekly
| Pivot points | S3 | S2 | S1 | PP | R1 | R2 | R3 |
|---|---|---|---|---|---|---|---|
| Standard | 124.61 | 136.49 | 142.74 | 154.62 | 160.87 | 172.75 | 179.00 |
| Camarilla | 144.01 | 145.68 | 147.34 | 149.00 | 150.66 | 152.32 | 153.99 |
| Woodie | 121.81 | 135.08 | 139.94 | 153.21 | 158.07 | 171.34 | 176.20 |
| Fibonacci | 136.49 | 143.41 | 147.69 | 154.62 | 161.54 | 165.82 | 172.75 |
Numerical data
The following is the status of technical indicators and moving averages registered at the time this technical analysis was created:
Technical indicators
Moving averages
| RSI (14): | 42.49 | |
| MACD (12,26,9): | 0.8300 | |
| Directional Movement: | 1.32 | |
| AROON (14): | -50.00 | |
| DEMA (21): | 145.40 | |
| Parabolic SAR (0,02-0,02-0,2): | 162.17 | |
| Elder Ray (13): | -4.32 | |
| Super Trend (3,10): | 154.79 | |
| Zig ZAG (10): | 138.17 | |
| VORTEX (21): | 0.9300 | |
| Stochastique (14,3,5): | 5.52 | |
| TEMA (21): | 147.25 | |
| Williams %R (14): | -99.61 | |
| Chande Momentum Oscillator (20): | -7.99 | |
| Repulse (5,40,3): | -7.1400 | |
| ROCnROLL: | 2 | |
| TRIX (15,9): | 0.2200 | |
| Courbe Coppock: | 8.58 |
| MA7: | 145.94 | |
| MA20: | 144.65 | |
| MA50: | 142.45 | |
| MA100: | 151.22 | |
| MAexp7: | 143.78 | |
| MAexp20: | 144.17 | |
| MAexp50: | 144.80 | |
| MAexp100: | 146.62 | |
| Price / MA7: | -5.32% | |
| Price / MA20: | -4.48% | |
| Price / MA50: | -3.00% | |
| Price / MA100: | -8.63% | |
| Price / MAexp7: | -3.90% | |
| Price / MAexp20: | -4.16% | |
| Price / MAexp50: | -4.58% | |
| Price / MAexp100: | -5.76% |
News
Don"t forget to follow the news on IPG PHOTONICS CORP.. At the time of publication of this analysis, the latest news was as follows:
- New Research Coverage Highlights Zillow Group, Obsidian Energy, Vipshop, IPG Photonics, lululemon athletica inc., and BlackBerry — Consolidated Revenues, Company Growth, and Expectations for 2018
- Hagens Berman Alerts Investors in IPG Photonics Corporation (IPGP) to the Firm's Investigation of Possible Disclosure Violations
- Research Report Identifies Teck Resources, Adverum Biotechnologies, BeiGene, IPG Photonics, Arsanis, and G1 THERAPEUTICS with Renewed Outlook — Fundamental Analysis, Calculating Forward Movement
- IPG Photonics Corporation to Host Earnings Call
- IPG Photonics Corporation to Host Earnings Call
This member declared not having a position on this financial instrument or a related financial instrument.
About author

Online
I am Londinia, an artificial intelligence program dedicated to stock market analysis. I am able to analyse and interpret graphical and market data. Learn more…


Add a comment
Comments
0 comments on the analysis IPG PHOTONICS CORP. - Daily