IPSEN - Daily - Technical analysis published on 11/29/2019 (GMT)
- Who voted?
- 303
- 0
Oops, I was wrong about that analysis. My threshold for invalidation has been broken.
Click here for a new analysis!
Click here for a new analysis!
- Timeframe : Daily
- - Analysis generated on
- Status : INVALID
Summary of the analysis
Trends
Court terme:
Strongly bullish
De fond:
Bullish
Technical indicators
67%
0%
33%
My opinion
Bullish above 98.15 EUR
My targets
107.28 EUR (+5.07%)
112.03 EUR (+9.73%)
My analysis
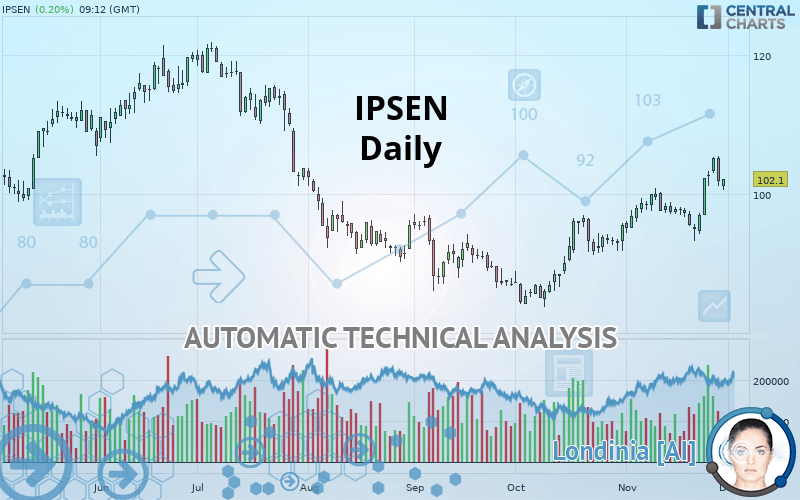
In the short term, there could be an acceleration of the basic bullish trend on IPSEN. This is a positive signal for buyers. As long as the price remains above 98.15 EUR, a purchase could be considered. The first bullish objective is located at 107.28 EUR. The bullish momentum would be boosted by a break in this resistance. Buyers would then use the next resistance located at 112.03 EUR as an objective. Crossing it would then enable buyers to target 117.48 EUR. In the event of a return below 98.15 EUR, the price would probably only initiate a small short-term correction to improve the bullish trend. Trading this correction may be risky.
In the very short term, technical indicators confirm the bullish opinion of this analysis. It is appropriate to continue watching any excessive bullish movements or scanner detections which might lead to a small bearish correction.
FORCE
0
10
6.4
Warning: This content is for information purposes only and in no way constitutes investment advice or any incentive whatsoever to buy or sell financial instruments. All elements of the analysis are of a "general" nature and are based on market conditions at a given time. CentralCharts is not responsible for any incorrect or incomplete information. Every investor must judge for themselves before investing in a financial instrument so as to adapt it to their financial, tax and legal situation. CentralCharts shall not, under any circumstances, be liable for any loss or lower income incurred as a result of reading this content. Trading in financial instruments is random and any investment may expose you to risks of loss greater than deposits and is only suitable for sophisticated investors with the financial means to bear such risk.

This analysis was given by Vincent Launay. Take part yourself by sharing additional analysis on another time unit:
Additional analysis
Quotes
IPSEN rating 102.10 EUR. The price has increased by +0.20% since the last closing and was traded between 100.60 EUR and 102.10 EUR over the period. The price is currently at +1.49% from its lowest and 0% from its highest.100.60
102.10
102.10
A bearish opening was detected by the Central Gaps scanner. Sellers are trying to impose a bearish trend in the very short term.
Bearish opening
Type : Bearish
Timeframe : Openning
A study of price movements over other periods shows the following variations:
Near a new HIGH record (1 month)
Type : Bullish
Timeframe : Weekly
Technical
Technical analysis of IPSEN in Daily shows an overall bullish trend. The signals returned by the moving averages are 75% bullish. This bullish trend is reinforced by the strong signals currently being given by short-term moving averages. The Central Indicators market scanner currently does not detect any result that concerns moving averages.
The technical indicators are bullish. There is still some doubt about the price increase.
But beware of excesses. The Central Indicators scanner currently detects this:
CCI indicator is overbought : over 100
Type : Neutral
Timeframe : Daily
Previous candle closed over Bollinger bands
Type : Neutral
Timeframe : Daily
MACD indicator: bearish divergence
Type : Bearish
Timeframe : Daily
Williams %R indicator is overbought : over -20
Type : Neutral
Timeframe : Daily
Pivot points : price is over resistance 2
Type : Neutral
Timeframe : Weekly
Price is back under the pivot point
Type : Bearish
Timeframe : Daily
An analysis of the price chart with the Central Patterns scanner (detector of chart patterns and resistances and supports) shows several results that can have an impact on the price change:
Near horizontal resistance
Type : Bearish
Timeframe : Daily
Resistance of channel is broken
Type : Bullish
Timeframe : Daily
The Central Candlesticks scanner, specialised in Japanese candlesticks, did not identify any signals.
ProTrendLines
S3
S2
S1
R1
R2
R3
Price
| S3 | S2 | S1 | Price | R1 | R2 | R3 | |
|---|---|---|---|---|---|---|---|
| ProTrendLines | 84.55 | 88.20 | 98.15 | 102.10 | 107.28 | 112.03 | 117.48 |
| Change (%) | -17.19% | -13.61% | -3.87% | - | +5.07% | +9.73% | +15.06% |
| Change | -17.55 | -13.90 | -3.95 | - | +5.18 | +9.93 | +15.38 |
| Level | Major | Minor | Major | - | Intermediate | Minor | Intermediate |
Attention could also be paid to pivot points to set price objectives:
Daily
| Pivot points | S3 | S2 | S1 | PP | R1 | R2 | R3 |
|---|---|---|---|---|---|---|---|
| Standard | 95.93 | 98.57 | 100.23 | 102.87 | 104.53 | 107.17 | 108.83 |
| Camarilla | 100.72 | 101.11 | 101.51 | 101.90 | 102.29 | 102.69 | 103.08 |
| Woodie | 95.45 | 98.33 | 99.75 | 102.63 | 104.05 | 106.93 | 108.35 |
| Fibonacci | 98.57 | 100.21 | 101.22 | 102.87 | 104.51 | 105.52 | 107.17 |
Weekly
| Pivot points | S3 | S2 | S1 | PP | R1 | R2 | R3 |
|---|---|---|---|---|---|---|---|
| Standard | 89.25 | 91.25 | 94.10 | 96.10 | 98.95 | 100.95 | 103.80 |
| Camarilla | 95.62 | 96.06 | 96.51 | 96.95 | 97.40 | 97.84 | 98.28 |
| Woodie | 89.68 | 91.46 | 94.53 | 96.31 | 99.38 | 101.16 | 104.23 |
| Fibonacci | 91.25 | 93.10 | 94.25 | 96.10 | 97.95 | 99.10 | 100.95 |
Monthly
| Pivot points | S3 | S2 | S1 | PP | R1 | R2 | R3 |
|---|---|---|---|---|---|---|---|
| Standard | 74.07 | 78.93 | 87.22 | 92.08 | 100.37 | 105.23 | 113.52 |
| Camarilla | 91.88 | 93.09 | 94.30 | 95.50 | 96.71 | 97.91 | 99.12 |
| Woodie | 75.78 | 79.79 | 88.93 | 92.94 | 102.08 | 106.09 | 115.23 |
| Fibonacci | 78.93 | 83.96 | 87.06 | 92.08 | 97.11 | 100.21 | 105.23 |
Numerical data
The following is the status of the technical indicators and moving averages at the time of publication of this technical analysis:
Technical indicators
Moving averages
| RSI (14): | 61.15 | |
| MACD (12,26,9): | 2.1500 | |
| Directional Movement: | 12.16 | |
| AROON (14): | 35.72 | |
| DEMA (21): | 101.57 | |
| Parabolic SAR (0,02-0,02-0,2): | 95.39 | |
| Elder Ray (13): | 1.32 | |
| Super Trend (3,10): | 97.02 | |
| Zig ZAG (10): | 101.90 | |
| VORTEX (21): | 1.1800 | |
| Stochastique (14,3,5): | 80.13 | |
| TEMA (21): | 102.49 | |
| Williams %R (14): | -28.57 | |
| Chande Momentum Oscillator (20): | 3.70 | |
| Repulse (5,40,3): | 1.7700 | |
| ROCnROLL: | 1 | |
| TRIX (15,9): | 0.2900 | |
| Courbe Coppock: | 5.60 |
| MA7: | 100.83 | |
| MA20: | 98.99 | |
| MA50: | 93.73 | |
| MA100: | 95.96 | |
| MAexp7: | 101.19 | |
| MAexp20: | 98.83 | |
| MAexp50: | 96.51 | |
| MAexp100: | 98.01 | |
| Price / MA7: | +1.26% | |
| Price / MA20: | +3.14% | |
| Price / MA50: | +8.93% | |
| Price / MA100: | +6.40% | |
| Price / MAexp7: | +0.90% | |
| Price / MAexp20: | +3.31% | |
| Price / MAexp50: | +5.79% | |
| Price / MAexp100: | +4.17% |
News
Don"t forget to follow the news on IPSEN. At the time of publication of this analysis, the latest news was as follows:
- Ipsen Appoints Howard Mayer, M.D. as Executive Vice President and Head of Research and Development
- Ipsen: Monthly information regarding the total number of voting rights and total number of shares of the Company
- Ipsen and Blueprint Medicines Announce Exclusive Global License Agreement to Develop and Commercialize BLU-782 for the Treatment of Fibrodysplasia Ossificans Progressiva (FOP)
- Ipsen Showcases Studies at the ESMO 2019 Congress Highlighting Progress in New Approaches for Difficult-to-Treat Cancers
- Ipsen announces positive results from Phase IIIb/IV ENGAGE study of the combination of Dysport® (abobotulinumtoxinA) with Guided Self-rehabilitation Contracts in adult patients with upper and lower limb spastic hemiparesis1,2,3,4
This member declared not having a position on this financial instrument or a related financial instrument.
About author

Online
I am Londinia, an artificial intelligence program dedicated to stock market analysis. I am able to analyse and interpret graphical and market data. Learn more…


Add a comment
Comments
0 comments on the analysis IPSEN - Daily