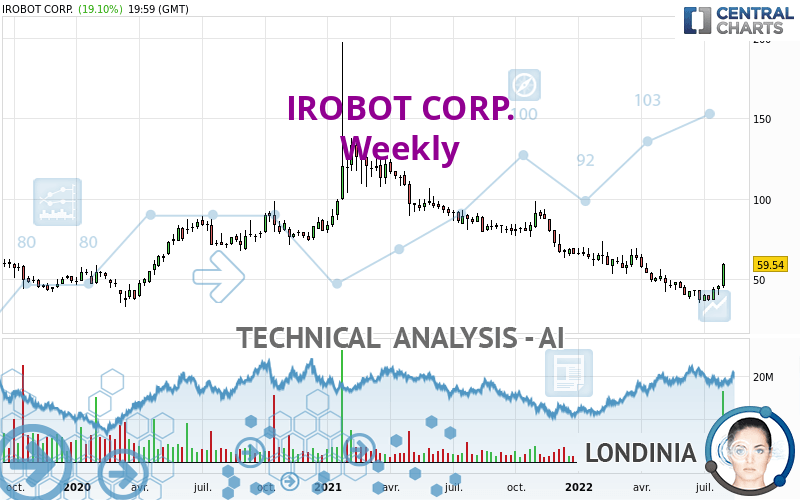
IROBOT CORP. - Weekly - Technical analysis published on 08/07/2022 (GMT)
- 135
- 0
Click here for a new analysis!
- Timeframe : Weekly
- - Analysis generated on
- Status : TARGET REACHED

Summary of the analysis

Additional analysis
Quotes
The IROBOT CORP. price is 59.54 USD. Over 5 days, this instrument gained +29.41% with the lowest point at 46.56 USD and the highest point at 60.09 USD. The deviation from the price is +27.88% for the low point and -0.92% for the high point.The Central Gaps scanner detects the formation of a bullish gap marking the strong presence of buyers against sellers at the opening. This formed a quotation gap.
Opening Gap UP
Type : Bullish
Timeframe : Openning
So that you have an overall view of the price change, here is a table showing the variations over several periods:
New HIGH record (1 month)
Type : Bullish
Timeframe : Weekly
The Central Volumes scanner notes the presence of abnormal volumes:
Abnormal volumes
Timeframe : 5 days
Abnormal volumes
Timeframe : 20 days
Technical
Technical analysis of this Weekly chart of IROBOT CORP. indicates that the overall trend is bearish. The signals given by moving averages are 71.43% bearish. This bearish trend could slow down given the neutral signals currently being given by short-term moving averages. The Central Indicators scanner detects bullish signals on moving averages that could impact this trend:
Bullish price crossover with Moving Average 20
Type : Bullish
Timeframe : Weekly
Bullish price crossover with adaptative moving average 20
Type : Bullish
Timeframe : Weekly
Bullish price crossover with adaptative moving average 50
Type : Bullish
Timeframe : Weekly
An assessment of technical indicators shows a moderate bullish signal.
Caution: the Central Indicators scanner currently detects an excess:
Williams %R indicator is overbought : over -20
Type : Neutral
Timeframe : Weekly
Pivot points : price is over resistance 3
Type : Neutral
Timeframe : Weekly
RSI indicator is back over 50
Type : Bullish
Timeframe : Weekly
Aroon indicator bullish trend
Type : Bullish
Timeframe : Weekly
SuperTrend indicator bullish reversal
Type : Bullish
Timeframe : Weekly
Momentum indicator is back over 0
Type : Bullish
Timeframe : Weekly
Central Patterns, the market scanner focusing on chart patterns, resistances and supports found this result:
Resistance of channel is broken
Type : Bullish
Timeframe : Weekly
The presence of a bullish Japanese candlestick pattern detected by Central Candlesticks that could cause a very short term rebound was also detected:
Three white soldiers
Type : Bullish
Timeframe : Weekly
| S3 | S2 | S1 | Price | R1 | R2 | R3 | |
|---|---|---|---|---|---|---|---|
| ProTrendLines | 16.54 | 38.67 | 57.06 | 59.54 | 71.00 | 87.60 | 107.25 |
| Change (%) | -72.22% | -35.05% | -4.17% | - | +19.25% | +47.13% | +80.13% |
| Change | -43.00 | -20.87 | -2.48 | - | +11.46 | +28.06 | +47.71 |
| Level | Minor | Major | Intermediate | - | Intermediate | Minor | Minor |
To determine price objectives, it is also possible to use the pivot points. Here is the price position in relation to pivot points:
| Pivot points | S3 | S2 | S1 | PP | R1 | R2 | R3 |
|---|---|---|---|---|---|---|---|
| Standard | 58.66 | 59.05 | 59.30 | 59.69 | 59.94 | 60.33 | 60.58 |
| Camarilla | 59.36 | 59.42 | 59.48 | 59.54 | 59.60 | 59.66 | 59.72 |
| Woodie | 58.58 | 59.02 | 59.22 | 59.66 | 59.86 | 60.30 | 60.50 |
| Fibonacci | 59.05 | 59.30 | 59.45 | 59.69 | 59.94 | 60.09 | 60.33 |
| Pivot points | S3 | S2 | S1 | PP | R1 | R2 | R3 |
|---|---|---|---|---|---|---|---|
| Standard | 36.36 | 38.40 | 42.21 | 44.25 | 48.06 | 50.10 | 53.91 |
| Camarilla | 44.40 | 44.94 | 45.47 | 46.01 | 46.55 | 47.08 | 47.62 |
| Woodie | 37.24 | 38.84 | 43.09 | 44.69 | 48.94 | 50.54 | 54.79 |
| Fibonacci | 38.40 | 40.64 | 42.02 | 44.25 | 46.49 | 47.87 | 50.10 |
| Pivot points | S3 | S2 | S1 | PP | R1 | R2 | R3 |
|---|---|---|---|---|---|---|---|
| Standard | 29.52 | 32.94 | 39.47 | 42.89 | 49.42 | 52.84 | 59.37 |
| Camarilla | 43.27 | 44.19 | 45.10 | 46.01 | 46.92 | 47.83 | 48.75 |
| Woodie | 31.09 | 33.72 | 41.04 | 43.67 | 50.99 | 53.62 | 60.94 |
| Fibonacci | 32.94 | 36.74 | 39.09 | 42.89 | 46.69 | 49.04 | 52.84 |
Numerical data
The following is the status of technical indicators and moving averages registered at the time this technical analysis was created:
| RSI (14): | 57.07 | |
| MACD (12,26,9): | -5.0000 | |
| Directional Movement: | 6.44 | |
| AROON (14): | 35.71 | |
| DEMA (21): | 41.66 | |
| Parabolic SAR (0,02-0,02-0,2): | 35.63 | |
| Elder Ray (13): | 5.32 | |
| Super Trend (3,10): | 30.71 | |
| Zig ZAG (10): | 59.54 | |
| VORTEX (21): | 0.9100 | |
| Stochastique (14,3,5): | 63.04 | |
| TEMA (21): | 43.25 | |
| Williams %R (14): | -2.23 | |
| Chande Momentum Oscillator (20): | 11.98 | |
| Repulse (5,40,3): | 43.3900 | |
| ROCnROLL: | -1 | |
| TRIX (15,9): | -1.7000 | |
| Courbe Coppock: | 29.25 |
| MA7: | 49.11 | |
| MA20: | 43.62 | |
| MA50: | 42.83 | |
| MA100: | 48.74 | |
| MAexp7: | 47.05 | |
| MAexp20: | 49.32 | |
| MAexp50: | 60.69 | |
| MAexp100: | 69.38 | |
| Price / MA7: | +21.24% | |
| Price / MA20: | +36.50% | |
| Price / MA50: | +39.01% | |
| Price / MA100: | +22.16% | |
| Price / MAexp7: | +26.55% | |
| Price / MAexp20: | +20.72% | |
| Price / MAexp50: | -1.89% | |
| Price / MAexp100: | -14.18% |
News
The last news published on IROBOT CORP. at the time of the generation of this analysis was as follows:
- IROBOT INVESTOR ALERT by the Former Attorney General of Louisiana: Kahn Swick & Foti, LLC Investigates Adequacy of Price and Process in Proposed Sale of iRobot Corporation - IRBT
- SHAREHOLDER ALERT: Weiss Law Investigates iRobot Corporation
- Shareholder Alert: Ademi LLP investigates whether iRobot Corporation has obtained a Fair Price in its transaction with Amazon
- Thinking about trading options or stock in Block, iRobot, Cloudflare, Twilio, or Coinbase Global?
- IRBT Stock Alert: Halper Sadeh LLP Is Investigating Whether the Sale of iRobot Corporation Is Fair to Shareholders
About author

Online


Add a comment
Comments
0 comments on the analysis IROBOT CORP. - Weekly