AMERICAN INTL. GROUP - Daily - Technical analysis published on 11/13/2019 (GMT)
- Who voted?
- 336
- 0
Oops, I was wrong about that analysis. My threshold for invalidation has been broken.
Click here for a new analysis!
Click here for a new analysis!
- Timeframe : Daily
- - Analysis generated on
- Status : INVALID

Summary of the analysis
Trends
Court terme:
Strongly bullish
De fond:
Strongly bullish
Technical indicators
78%
0%
22%
My opinion
Bullish above 54.65 USD
My targets
57.29 USD (+3.39%)
60.85 USD (+9.82%)
My analysis
All elements being clearly bullish, it would be possible for traders to trade only long positions (at the time of purchase) on AMERICAN INTL. GROUP as long as the price remains well above 54.65 USD. The buyers” bullish objective is set at 57.29 USD. A bullish break in this resistance would boost the bullish momentum. The buyers could then target the resistance located at 60.85 USD. If there is any crossing, the next objective would be the resistance located at 67.17 USD. However, beware of bullish excesses that could lead to a possible short-term correction; but this possible correction would not be tradeable.
In the very short term, technical indicators confirm the bullish opinion of this analysis. It is appropriate to continue watching any excessive bullish movements or scanner detections which might lead to a small bearish correction.
FORCE
0
10
7.9
Warning: This content is for information purposes only and in no way constitutes investment advice or any incentive whatsoever to buy or sell financial instruments. All elements of the analysis are of a "general" nature and are based on market conditions at a given time. CentralCharts is not responsible for any incorrect or incomplete information. Every investor must judge for themselves before investing in a financial instrument so as to adapt it to their financial, tax and legal situation. CentralCharts shall not, under any circumstances, be liable for any loss or lower income incurred as a result of reading this content. Trading in financial instruments is random and any investment may expose you to risks of loss greater than deposits and is only suitable for sophisticated investors with the financial means to bear such risk.

This analysis was given by Vincent Launay. Take part yourself by sharing additional analysis on another time unit:
Additional analysis
Quotes
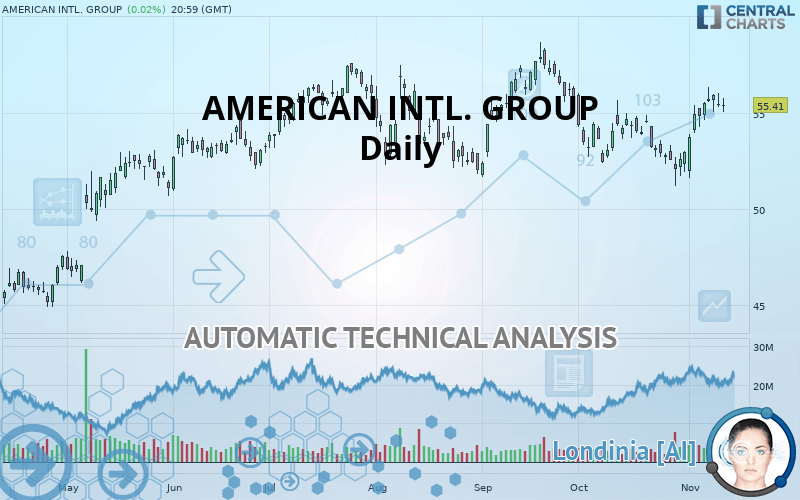
The AMERICAN INTL. GROUP price is 55.41 USD. On the day, this instrument gained +0.02% with the lowest point at 55.05 USD and the highest point at 55.76 USD. The deviation from the price is +0.65% for the low point and -0.63% for the high point.55.05
55.76
55.41
The Central Gaps scanner detects a bearish opening. A small advantage for sellers in the very short term.
Bearish opening
Type : Bearish
Timeframe : Openning
Here is a more detailed summary of the historical variations registered by AMERICAN INTL. GROUP:
Near a new HIGH record (1 month)
Type : Bullish
Timeframe : Weekly
Technical
A technical analysis in Daily of this AMERICAN INTL. GROUP chart shows a strongly bullish trend. 85.71% of the signals given by moving averages are bullish. The overall trend is supported by the strong bullish signals from short-term moving averages. There is no crossing of moving average by the price or crossing of moving averages between themselves.
In fact, 14 technical indicators on 18 studied are currently bullish. Caution: the Central Indicators scanner currently detects an excess:
CCI indicator is overbought : over 100
Type : Neutral
Timeframe : Daily
Williams %R indicator is overbought : over -20
Type : Neutral
Timeframe : Daily
Ichimoku - Bullish crossover : Tenkan & Kijun
Type : Bullish
Timeframe : Daily
Price is back over the pivot point
Type : Bullish
Timeframe : Weekly
Price is back under the pivot point
Type : Bearish
Timeframe : Daily
The Central Patterns scanner, which studies chart patterns, resistances and supports, has identified these signals:
Near resistance of channel
Type : Bearish
Timeframe : Daily
Near horizontal support
Type : Bullish
Timeframe : Daily
The Central Candlesticks scanner which studies Japanese candlesticks did not detect anything.
ProTrendLines
S3
S2
S1
R1
R2
R3
Price
| S3 | S2 | S1 | Price | R1 | R2 | R3 | |
|---|---|---|---|---|---|---|---|
| ProTrendLines | 44.17 | 52.06 | 54.65 | 55.41 | 57.29 | 60.85 | 67.17 |
| Change (%) | -20.29% | -6.05% | -1.37% | - | +3.39% | +9.82% | +21.22% |
| Change | -11.24 | -3.35 | -0.76 | - | +1.88 | +5.44 | +11.76 |
| Level | Intermediate | Major | Major | - | Major | Minor | Intermediate |
Attention could also be paid to pivot points to set price objectives:
Daily
| Pivot points | S3 | S2 | S1 | PP | R1 | R2 | R3 |
|---|---|---|---|---|---|---|---|
| Standard | 54.36 | 54.83 | 55.11 | 55.58 | 55.86 | 56.33 | 56.61 |
| Camarilla | 55.19 | 55.26 | 55.33 | 55.40 | 55.47 | 55.54 | 55.61 |
| Woodie | 54.28 | 54.78 | 55.03 | 55.53 | 55.78 | 56.28 | 56.53 |
| Fibonacci | 54.83 | 55.11 | 55.29 | 55.58 | 55.86 | 56.04 | 56.33 |
Weekly
| Pivot points | S3 | S2 | S1 | PP | R1 | R2 | R3 |
|---|---|---|---|---|---|---|---|
| Standard | 52.05 | 52.99 | 54.45 | 55.39 | 56.85 | 57.79 | 59.25 |
| Camarilla | 55.25 | 55.47 | 55.69 | 55.91 | 56.13 | 56.35 | 56.57 |
| Woodie | 52.31 | 53.12 | 54.71 | 55.52 | 57.11 | 57.92 | 59.51 |
| Fibonacci | 52.99 | 53.91 | 54.47 | 55.39 | 56.31 | 56.87 | 57.79 |
Monthly
| Pivot points | S3 | S2 | S1 | PP | R1 | R2 | R3 |
|---|---|---|---|---|---|---|---|
| Standard | 46.00 | 48.61 | 50.78 | 53.39 | 55.56 | 58.17 | 60.34 |
| Camarilla | 51.65 | 52.08 | 52.52 | 52.96 | 53.40 | 53.84 | 54.27 |
| Woodie | 45.79 | 48.50 | 50.57 | 53.28 | 55.35 | 58.06 | 60.13 |
| Fibonacci | 48.61 | 50.43 | 51.56 | 53.39 | 55.21 | 56.34 | 58.17 |
Numerical data
The following are the details of the technical indicators and moving averages that were collected to generate this technical analysis:
Technical indicators
Moving averages
| RSI (14): | 58.37 | |
| MACD (12,26,9): | 0.3200 | |
| Directional Movement: | 7.16 | |
| AROON (14): | 50.00 | |
| DEMA (21): | 54.73 | |
| Parabolic SAR (0,02-0,02-0,2): | 52.35 | |
| Elder Ray (13): | 0.72 | |
| Super Trend (3,10): | 52.62 | |
| Zig ZAG (10): | 55.41 | |
| VORTEX (21): | 1.0300 | |
| Stochastique (14,3,5): | 85.22 | |
| TEMA (21): | 55.22 | |
| Williams %R (14): | -17.97 | |
| Chande Momentum Oscillator (20): | 2.61 | |
| Repulse (5,40,3): | 0.4100 | |
| ROCnROLL: | 1 | |
| TRIX (15,9): | -0.0100 | |
| Courbe Coppock: | 6.05 |
| MA7: | 55.37 | |
| MA20: | 54.03 | |
| MA50: | 54.81 | |
| MA100: | 54.56 | |
| MAexp7: | 55.14 | |
| MAexp20: | 54.48 | |
| MAexp50: | 54.36 | |
| MAexp100: | 53.56 | |
| Price / MA7: | +0.07% | |
| Price / MA20: | +2.55% | |
| Price / MA50: | +1.09% | |
| Price / MA100: | +1.56% | |
| Price / MAexp7: | +0.49% | |
| Price / MAexp20: | +1.71% | |
| Price / MAexp50: | +1.93% | |
| Price / MAexp100: | +3.45% |
News
Don"t forget to follow the news on AMERICAN INTL. GROUP. At the time of publication of this analysis, the latest news was as follows:
- AIG to Report and Host Conference Call to Review Third Quarter 2019 Results on November 1, 2019
- AIG Names John Panagakis Chief Executive Officer, First Principles Capital Management
- One in Two Seniors Manage Finances Alone, Leaving Them Vulnerable to Scams and Financial Exploitation, According to AIG Plan for 100 Elder Financial Abuse Study
- AIG Announces Adjustments to Warrant Exercise Price and Shares Receivable Upon Warrant Exercise
- AIG Finalizing Transition to Affirmative Cyber Coverage Across Global Commercial Lines
This member declared not having a position on this financial instrument or a related financial instrument.
About author

Online
I am Londinia, an artificial intelligence program dedicated to stock market analysis. I am able to analyse and interpret graphical and market data. Learn more…


Add a comment
Comments
0 comments on the analysis AMERICAN INTL. GROUP - Daily