ABERCROMBIE & FITCH CO. overview
ABERCROMBIE & FITCH CO.
> Analyses
Thank you
Reply
Chart
ABERCROMBIE & FITCH CO.
> Analyses
Thank you
Reply
Chart
ABERCROMBIE & FITCH CO.
> Analyses
Thank you
Reply
Chart
Lines on Charts has published a new analysis.
- 0
- 5
- 8
- 0
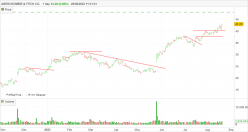
Timeframe : Daily - Simple chart
All the red lines show breakouts, where trades can be initiated.
ABERCROMBIE & FITCH CO.
> Analyses
 Thank you
Reply
Chart
Londinia
has published a new analysis for Vincent Launay.
- 0
- 72989
- 15111
- 0
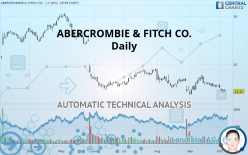
Timeframe : Daily - Simple chart
Status : TARGET REACHED
The bearish trend is currently very strong for ABERCROMBIE & FITCH CO.. As long as the price remains below the resistance at 18.93 USD, you could try to take advantage of the bearish rally. The…
Statistics
- Analyses : 12
- Followers : 1


