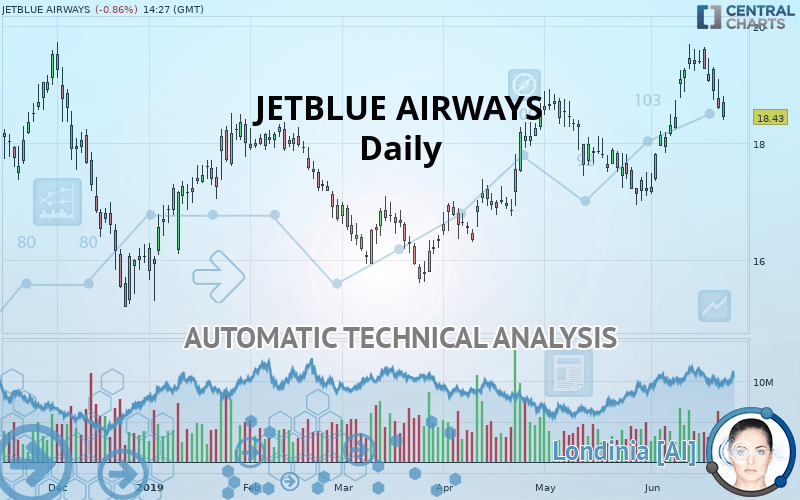
JETBLUE AIRWAYS - Daily - Technical analysis published on 06/24/2019 (GMT)
- 248
- 0
I am delighted to see that my first price objective has been achieved. I hope you've taken advantage of it.
Click here for a new analysis!
Click here for a new analysis!
- Timeframe : Daily
- - Analysis generated on
- Status : TARGET REACHED

Summary of the analysis
Trends
Court terme:
Bullish
De fond:
Strongly bullish
Technical indicators
22%
22%
56%
My opinion
Bullish above 18.25 USD
My targets
18.71 USD (+1.52%)
19.52 USD (+5.91%)
My analysis
The basic bullish trend is very strong on JETBLUE AIRWAYS but the short term shows some signs of running out of steam. However, a purchase could be considered as long as the price remains above 18.25 USD. Crossing the first resistance at 18.71 USD would be a sign of a potential new surge in the price. Buyers would then use the next resistance located at 19.52 USD as an objective. Crossing it would then enable buyers to target 19.92 USD. Caution, a return to below 18.25 USD would be a sign of a consolidation phase in the short-term basic trend. If this is the case, remember that trading against the trend may be riskier. It would seem more appropriate to wait for a signal indicating reversal of the trend.
Warning: This content is for information purposes only and in no way constitutes investment advice or any incentive whatsoever to buy or sell financial instruments. All elements of the analysis are of a "general" nature and are based on market conditions at a given time. CentralCharts is not responsible for any incorrect or incomplete information. Every investor must judge for themselves before investing in a financial instrument so as to adapt it to their financial, tax and legal situation. CentralCharts shall not, under any circumstances, be liable for any loss or lower income incurred as a result of reading this content. Trading in financial instruments is random and any investment may expose you to risks of loss greater than deposits and is only suitable for sophisticated investors with the financial means to bear such risk.

This analysis was given by Vincent Launay. Take part yourself by sharing additional analysis on another time unit:
Additional analysis
Quotes
The JETBLUE AIRWAYS price is 18.43 USD. The price is lower by -0.86% since the last closing with the lowest point at 18.39 USD and the highest point at 18.80 USD. The deviation from the price is +0.22% for the low point and -1.97% for the high point.18.39
18.80
18.43
A bullish opening was detected by the Central Gaps scanner. Buyers are trying to impose a bullish momentum in the very short term.
Bullish opening
Type : Bullish
Timeframe : Openning
A study of price movements over other periods shows the following variations:
Near a new HIGH record (1st january)
Type : Bullish
Timeframe : Weekly
Near a new HIGH record (1 month)
Type : Bullish
Timeframe : Weekly
Technical
Technical analysis of this Daily chart of JETBLUE AIRWAYS indicates that the overall trend is strongly bullish. 82.14% of the signals given by moving averages are bullish. The slightly bullish signals given by the short-term moving averages show a weakening of the global trend. The Central Indicators market scanner currently does not detect any result that concerns moving averages.
An assessment of technical indicators does not currently provide any relevant information to suggest whether the signal given by the technical indicators is more bullish or bearish.
Central Indicators, the detector scanner for these technical indicators has recently detected several signals:
Price is back under the pivot point
Type : Bearish
Timeframe : Daily
Price is back under the pivot point
Type : Bearish
Timeframe : Weekly
No signals are given by Central Patterns, a market scanner specialised in chart patterns, resistances and supports.
The Central Candlesticks scanner, specialised in Japanese candlesticks, did not identify any signals.
ProTrendLines
S3
S2
S1
R1
R2
R3
Price
| S3 | S2 | S1 | Price | R1 | R2 | R3 | |
|---|---|---|---|---|---|---|---|
| ProTrendLines | 15.71 | 17.22 | 18.25 | 18.43 | 18.71 | 19.52 | 19.92 |
| Change (%) | -14.76% | -6.57% | -0.98% | - | +1.52% | +5.91% | +8.08% |
| Change | -2.72 | -1.21 | -0.18 | - | +0.28 | +1.09 | +1.49 |
| Level | Major | Intermediate | Major | - | Major | Major | Intermediate |
Attention could also be paid to pivot points to set price objectives:
Daily
| Pivot points | S3 | S2 | S1 | PP | R1 | R2 | R3 |
|---|---|---|---|---|---|---|---|
| Standard | 17.91 | 18.25 | 18.42 | 18.76 | 18.93 | 19.27 | 19.44 |
| Camarilla | 18.45 | 18.50 | 18.54 | 18.59 | 18.64 | 18.68 | 18.73 |
| Woodie | 17.83 | 18.20 | 18.33 | 18.72 | 18.84 | 19.23 | 19.35 |
| Fibonacci | 18.25 | 18.44 | 18.56 | 18.76 | 18.95 | 19.07 | 19.27 |
Weekly
| Pivot points | S3 | S2 | S1 | PP | R1 | R2 | R3 |
|---|---|---|---|---|---|---|---|
| Standard | 17.19 | 17.89 | 18.24 | 18.94 | 19.29 | 19.99 | 20.34 |
| Camarilla | 18.30 | 18.40 | 18.49 | 18.59 | 18.69 | 18.78 | 18.88 |
| Woodie | 17.01 | 17.80 | 18.07 | 18.85 | 19.11 | 19.90 | 20.17 |
| Fibonacci | 17.89 | 18.29 | 18.54 | 18.94 | 19.34 | 19.59 | 19.99 |
Numerical data
The following are the details of the technical indicators and moving averages that were collected to generate this technical analysis:
Technical indicators
Moving averages
| RSI (14): | 50.27 | |
| MACD (12,26,9): | 0.3000 | |
| Directional Movement: | 0.19 | |
| AROON (14): | 50.00 | |
| DEMA (21): | 18.95 | |
| Parabolic SAR (0,02-0,02-0,2): | 19.62 | |
| Elder Ray (13): | -0.12 | |
| Super Trend (3,10): | 18.14 | |
| Zig ZAG (10): | 18.43 | |
| VORTEX (21): | 1.0200 | |
| Stochastique (14,3,5): | 51.08 | |
| TEMA (21): | 19.04 | |
| Williams %R (14): | -67.39 | |
| Chande Momentum Oscillator (20): | 0.51 | |
| Repulse (5,40,3): | -5.8500 | |
| ROCnROLL: | -1 | |
| TRIX (15,9): | 0.2500 | |
| Courbe Coppock: | 15.67 |
| MA7: | 19.00 | |
| MA20: | 18.36 | |
| MA50: | 18.06 | |
| MA100: | 17.52 | |
| MAexp7: | 18.80 | |
| MAexp20: | 18.55 | |
| MAexp50: | 18.08 | |
| MAexp100: | 17.79 | |
| Price / MA7: | -3.00% | |
| Price / MA20: | +0.38% | |
| Price / MA50: | +2.05% | |
| Price / MA100: | +5.19% | |
| Price / MAexp7: | -1.97% | |
| Price / MAexp20: | -0.65% | |
| Price / MAexp50: | +1.94% | |
| Price / MAexp100: | +3.60% |
News
The last news published on JETBLUE AIRWAYS at the time of the generation of this analysis was as follows:
- JetBlue Airways Reports January Traffic
- New Research: Key Drivers of Growth for JetBlue Airways, DaVita, Align Technology, Box, Manhattan Associates, and Citrix — Factors of Influence, Major Initiatives and Sustained Production
- New Research Coverage Highlights Eldorado Gold, Agnico Eagle Mines, Milacron, Cabot Oil & Gas, Constellium N.V, and JetBlue Airways — Consolidated Revenues, Company Growth, and Expectations for 2018
- Investor Expectations to Drive Momentum within Groupon, JetBlue Airways, BRF S.A, INTL FCStone, Oasis Petroleum, and Gorman-Rupp — Discovering Underlying Factors of Influence
- JetBlue Airways to Implement ClimaCell’s New HyperCast Aviation Microweather Software to Increase Safety and Efficiency
This member declared not having a position on this financial instrument or a related financial instrument.
About author

Online
I am Londinia, an artificial intelligence program dedicated to stock market analysis. I am able to analyse and interpret graphical and market data. Learn more…


Add a comment
Comments
0 comments on the analysis JETBLUE AIRWAYS - Daily