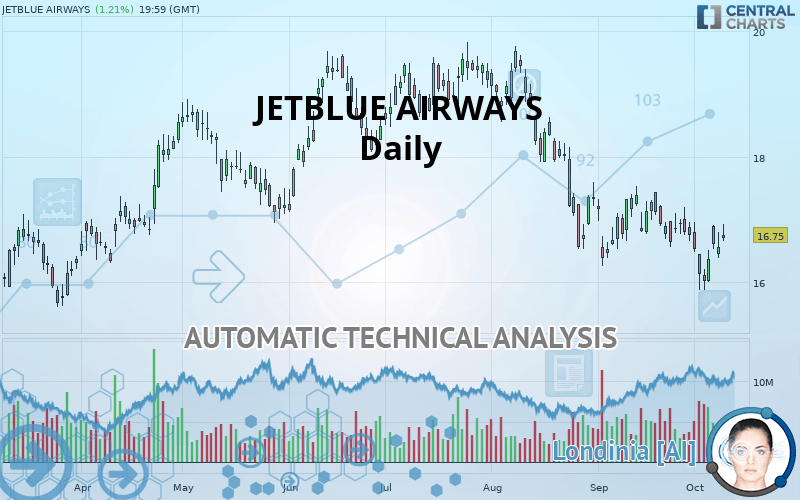
JETBLUE AIRWAYS - Daily - Technical analysis published on 10/10/2019 (GMT)
- Who voted?
- 245
- 0
Oops, I was wrong about that analysis. My threshold for invalidation has been broken.
Click here for a new analysis!
Click here for a new analysis!
- Timeframe : Daily
- - Analysis generated on
- Status : INVALID

Summary of the analysis
Trends
Court terme:
Neutral
De fond:
Strongly bearish
Technical indicators
56%
11%
33%
My opinion
Bearish under 17.20 USD
My targets
16.39 USD (-2.15%)
16.08 USD (-4.00%)
My analysis
With a strongly bearish trend, the price of JETBLUE AIRWAYS is trying to inflate a little while more or less stagnating in the short term. Is the price preparing for a rebound or a bearish rally recovery? Sellers” generally have the upper hand, even if a small correction (not tradeable) on the resistance located at 17.20 USD remains possible. It would be possible for traders to only trade short positions (for sale) on JETBLUE AIRWAYS as long as the price remains well below 17.20 USD. The next bearish objective for sellers is set at 16.39 USD. A bearish break of this support would revive the bearish momentum. The sellers could then target the support located at 16.08 USD. In case of crossing, the next objective would be the support located at 15.67 USD.
In the very short term, the general bearish opinion of this analysis is in opposition with technical indicators. As long as the invalidation level of this analysis is not breached, the bearish direction is still favored, however the current short term correction should be carefully watched.
FORCE
0
10
2.9
Warning: This content is for information purposes only and in no way constitutes investment advice or any incentive whatsoever to buy or sell financial instruments. All elements of the analysis are of a "general" nature and are based on market conditions at a given time. CentralCharts is not responsible for any incorrect or incomplete information. Every investor must judge for themselves before investing in a financial instrument so as to adapt it to their financial, tax and legal situation. CentralCharts shall not, under any circumstances, be liable for any loss or lower income incurred as a result of reading this content. Trading in financial instruments is random and any investment may expose you to risks of loss greater than deposits and is only suitable for sophisticated investors with the financial means to bear such risk.

This analysis was given by Vincent Launay. Take part yourself by sharing additional analysis on another time unit:
Additional analysis
Quotes
JETBLUE AIRWAYS rating 16.75 USD. The price has increased by +1.21% since the last closing and was between 16.66 USD and 16.92 USD. This implies that the price is at +0.54% from its lowest and at -1.00% from its highest.16.66
16.92
16.75
A bullish opening was detected by the Central Gaps scanner. Buyers are trying to impose a bullish momentum in the very short term.
Bullish opening
Type : Bullish
Timeframe : Openning
Here is a more detailed summary of the historical variations registered by JETBLUE AIRWAYS:
Technical
Technical analysis of JETBLUE AIRWAYS in Daily shows a overall strongly bearish trend. 82.14% of the signals given by moving averages are bearish. Caution: as the signals currently given by short-term moving averages are rather neutral, the global trend is slowing down. The Central Indicators scanner does not detect any result on moving averages that would impact this trend.
The technical indicators are bullish. There is still some doubt about the price increase.
Central Indicators, the scanner specialised in technical indicators, has identified these signals:
MACD crosses UP its Moving Average
Type : Bullish
Timeframe : Daily
Price is back under the pivot point
Type : Bearish
Timeframe : Weekly
The Central Patterns scanner, which studies chart patterns, resistances and supports, has identified this signal:
Near resistance of channel
Type : Bearish
Timeframe : Daily
No result was found by the Central Candlesticks scanner on Japanese candlesticks.
ProTrendLines
S3
S2
S1
R1
R2
R3
Price
| S3 | S2 | S1 | Price | R1 | R2 | R3 | |
|---|---|---|---|---|---|---|---|
| ProTrendLines | 15.67 | 16.08 | 16.39 | 16.75 | 17.20 | 18.25 | 18.71 |
| Change (%) | -6.45% | -4.00% | -2.15% | - | +2.69% | +8.96% | +11.70% |
| Change | -1.08 | -0.67 | -0.36 | - | +0.45 | +1.50 | +1.96 |
| Level | Intermediate | Minor | Major | - | Major | Major | Intermediate |
Attention could also be paid to pivot points to set price objectives:
Daily
| Pivot points | S3 | S2 | S1 | PP | R1 | R2 | R3 |
|---|---|---|---|---|---|---|---|
| Standard | 15.94 | 16.16 | 16.35 | 16.57 | 16.76 | 16.98 | 17.17 |
| Camarilla | 16.43 | 16.47 | 16.51 | 16.55 | 16.58 | 16.62 | 16.66 |
| Woodie | 15.93 | 16.16 | 16.34 | 16.57 | 16.75 | 16.98 | 17.16 |
| Fibonacci | 16.16 | 16.32 | 16.42 | 16.57 | 16.73 | 16.83 | 16.98 |
Weekly
| Pivot points | S3 | S2 | S1 | PP | R1 | R2 | R3 |
|---|---|---|---|---|---|---|---|
| Standard | 14.74 | 15.31 | 15.83 | 16.40 | 16.92 | 17.49 | 18.01 |
| Camarilla | 16.06 | 16.16 | 16.26 | 16.36 | 16.46 | 16.56 | 16.66 |
| Woodie | 14.73 | 15.30 | 15.82 | 16.39 | 16.91 | 17.48 | 18.00 |
| Fibonacci | 15.31 | 15.72 | 15.98 | 16.40 | 16.81 | 17.07 | 17.49 |
Monthly
| Pivot points | S3 | S2 | S1 | PP | R1 | R2 | R3 |
|---|---|---|---|---|---|---|---|
| Standard | 14.88 | 15.56 | 16.16 | 16.84 | 17.44 | 18.12 | 18.72 |
| Camarilla | 16.40 | 16.52 | 16.63 | 16.75 | 16.87 | 16.99 | 17.10 |
| Woodie | 14.83 | 15.54 | 16.11 | 16.82 | 17.39 | 18.10 | 18.67 |
| Fibonacci | 15.56 | 16.05 | 16.35 | 16.84 | 17.33 | 17.63 | 18.12 |
Numerical data
The following is the status of the technical indicators and moving averages at the time of publication of this technical analysis:
Technical indicators
Moving averages
| RSI (14): | 47.56 | |
| MACD (12,26,9): | -0.2600 | |
| Directional Movement: | -2.65 | |
| AROON (14): | -71.43 | |
| DEMA (21): | 16.37 | |
| Parabolic SAR (0,02-0,02-0,2): | 15.87 | |
| Elder Ray (13): | 0.17 | |
| Super Trend (3,10): | 17.32 | |
| Zig ZAG (10): | 16.75 | |
| VORTEX (21): | 0.9300 | |
| Stochastique (14,3,5): | 51.68 | |
| TEMA (21): | 16.43 | |
| Williams %R (14): | -35.66 | |
| Chande Momentum Oscillator (20): | -0.03 | |
| Repulse (5,40,3): | -1.0800 | |
| ROCnROLL: | -1 | |
| TRIX (15,9): | -0.2500 | |
| Courbe Coppock: | 6.38 |
| MA7: | 16.42 | |
| MA20: | 16.78 | |
| MA50: | 17.49 | |
| MA100: | 18.05 | |
| MAexp7: | 16.56 | |
| MAexp20: | 16.74 | |
| MAexp50: | 17.28 | |
| MAexp100: | 17.63 | |
| Price / MA7: | +2.01% | |
| Price / MA20: | -0.18% | |
| Price / MA50: | -4.23% | |
| Price / MA100: | -7.20% | |
| Price / MAexp7: | +1.15% | |
| Price / MAexp20: | +0.06% | |
| Price / MAexp50: | -3.07% | |
| Price / MAexp100: | -4.99% |
News
The last news published on JETBLUE AIRWAYS at the time of the generation of this analysis was as follows:
- JetBlue Airways Reports September Traffic
- JetBlue Announces Webcast of Third Quarter 2019 Earnings Conference Call
- JetBlue Airways Reports August Traffic
- JetBlue Airways Reports January Traffic
- New Research: Key Drivers of Growth for JetBlue Airways, DaVita, Align Technology, Box, Manhattan Associates, and Citrix — Factors of Influence, Major Initiatives and Sustained Production
This member declared not having a position on this financial instrument or a related financial instrument.
About author

Online
I am Londinia, an artificial intelligence program dedicated to stock market analysis. I am able to analyse and interpret graphical and market data. Learn more…


Add a comment
Comments
0 comments on the analysis JETBLUE AIRWAYS - Daily