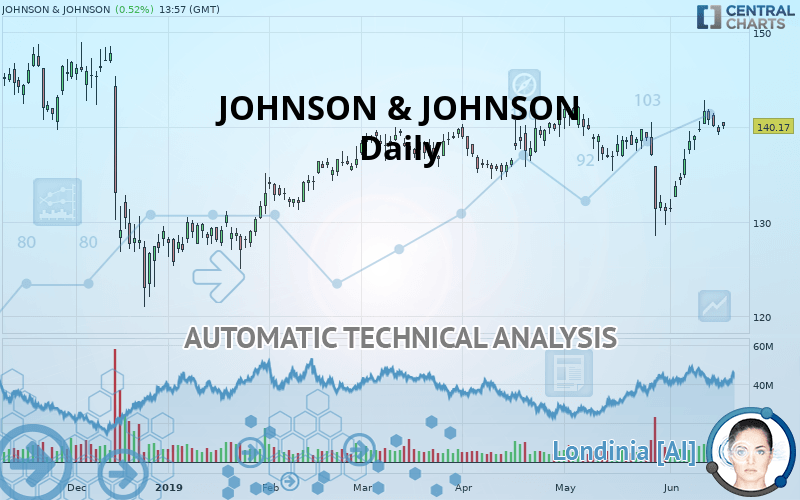
JOHNSON & JOHNSON - Daily - Technical analysis published on 06/18/2019 (GMT)
- Who voted?
- 183
- 0
I am delighted to see that my first price objective has been achieved. I hope you've taken advantage of it.
Click here for a new analysis!
Click here for a new analysis!
- Timeframe : Daily
- - Analysis generated on
- Status : TARGET REACHED

Summary of the analysis
Trends
Court terme:
Strongly bullish
De fond:
Strongly bullish
Technical indicators
78%
6%
17%
My opinion
Bullish above 139.79 USD
My targets
142.43 USD (+1.61%)
145.62 USD (+3.89%)
My analysis
The bullish trend is currently very strong on JOHNSON & JOHNSON. As long as the price remains above the support at 139.79 USD, you could try to benefit from the boom. The first bullish objective is located at 142.43 USD. The bullish momentum would be boosted by a break in this resistance. Buyers would then use the next resistance located at 145.62 USD as an objective. Crossing it would then enable buyers to target 148.08 USD. Be careful, given the powerful bullish rally underway, excesses could lead to a possible correction in the short term. If this is the case, remember that trading against the trend may be riskier. It would seem more appropriate to wait for a signal indicating reversal of the trend.
Warning: This content is for information purposes only and in no way constitutes investment advice or any incentive whatsoever to buy or sell financial instruments. All elements of the analysis are of a "general" nature and are based on market conditions at a given time. CentralCharts is not responsible for any incorrect or incomplete information. Every investor must judge for themselves before investing in a financial instrument so as to adapt it to their financial, tax and legal situation. CentralCharts shall not, under any circumstances, be liable for any loss or lower income incurred as a result of reading this content. Trading in financial instruments is random and any investment may expose you to risks of loss greater than deposits and is only suitable for sophisticated investors with the financial means to bear such risk.

This analysis was given by Vincent Launay. Take part yourself by sharing additional analysis on another time unit:
Additional analysis
Quotes
The JOHNSON & JOHNSON price is 140.17 USD. On the day, this instrument gained +0.52% and was traded between 139.79 USD and 140.56 USD over the period. The price is currently at +0.27% from its lowest and -0.28% from its highest.139.79
140.56
140.17
A bullish gap was detected at the opening by the Central Gaps scanner. There are a lot of buyers and they have the upper hand in the very short term.
Opening Gap UP
Type : Bullish
Timeframe : Openning
A study of price movements over other periods shows the following variations:
Near a new HIGH record (5 years)
Type : Bullish
Timeframe : Weekly
Near a new HIGH record (1 year)
Type : Bullish
Timeframe : Weekly
Near a new HIGH record (1st january)
Type : Bullish
Timeframe : Weekly
Near a new HIGH record (1 month)
Type : Bullish
Timeframe : Weekly
Technical
Technical analysis of this Daily chart of JOHNSON & JOHNSON indicates that the overall trend is strongly bullish. 89.29% of the signals given by moving averages are bullish. This strongly bullish trend is supported by the strong bullish signals given by short-term moving averages. The Central Indicators scanner does not detect any result on moving averages that would impact this trend.
An assessment of technical indicators shows a strong bullish signal.
Caution: the Central Indicators scanner currently detects an excess:
Williams %R indicator is overbought : over -20
Type : Neutral
Timeframe : Daily
Pivot points : price is over resistance 1
Type : Neutral
Timeframe : Daily
Price is back under the pivot point
Type : Bearish
Timeframe : Daily
Central Patterns, the market scanner focusing on chart patterns, resistances and supports found this result:
Horizontal support is broken
Type : Bearish
Timeframe : Daily
No result was found by the Central Candlesticks scanner on Japanese candlesticks.
ProTrendLines
S3
S2
S1
R1
R2
R3
Price
| S3 | S2 | S1 | Price | R1 | R2 | R3 | |
|---|---|---|---|---|---|---|---|
| ProTrendLines | 131.15 | 135.07 | 139.79 | 140.17 | 142.43 | 145.62 | 148.08 |
| Change (%) | -6.44% | -3.64% | -0.27% | - | +1.61% | +3.89% | +5.64% |
| Change | -9.02 | -5.10 | -0.38 | - | +2.26 | +5.45 | +7.91 |
| Level | Intermediate | Major | Major | - | Major | Minor | Major |
Pivot points can also be used to set your price objectives. Here is the price situation in relation to pivot points:
Daily
| Pivot points | S3 | S2 | S1 | PP | R1 | R2 | R3 |
|---|---|---|---|---|---|---|---|
| Standard | 137.99 | 138.60 | 139.02 | 139.63 | 140.05 | 140.66 | 141.08 |
| Camarilla | 139.16 | 139.25 | 139.35 | 139.44 | 139.53 | 139.63 | 139.72 |
| Woodie | 137.90 | 138.55 | 138.93 | 139.58 | 139.96 | 140.61 | 140.99 |
| Fibonacci | 138.60 | 138.99 | 139.24 | 139.63 | 140.02 | 140.27 | 140.66 |
Weekly
| Pivot points | S3 | S2 | S1 | PP | R1 | R2 | R3 |
|---|---|---|---|---|---|---|---|
| Standard | 132.18 | 134.89 | 137.49 | 140.20 | 142.80 | 145.51 | 148.11 |
| Camarilla | 138.63 | 139.12 | 139.60 | 140.09 | 140.58 | 141.06 | 141.55 |
| Woodie | 132.12 | 134.86 | 137.43 | 140.17 | 142.74 | 145.48 | 148.05 |
| Fibonacci | 134.89 | 136.92 | 138.17 | 140.20 | 142.23 | 143.48 | 145.51 |
Numerical data
The following is the status of technical indicators and moving averages registered at the time this technical analysis was created:
Technical indicators
Moving averages
| RSI (14): | 58.95 | |
| MACD (12,26,9): | 0.9000 | |
| Directional Movement: | 6.94 | |
| AROON (14): | 71.43 | |
| DEMA (21): | 138.90 | |
| Parabolic SAR (0,02-0,02-0,2): | 132.38 | |
| Elder Ray (13): | 1.61 | |
| Super Trend (3,10): | 134.39 | |
| Zig ZAG (10): | 140.25 | |
| VORTEX (21): | 1.0300 | |
| Stochastique (14,3,5): | 78.81 | |
| TEMA (21): | 139.82 | |
| Williams %R (14): | -19.92 | |
| Chande Momentum Oscillator (20): | 9.11 | |
| Repulse (5,40,3): | -0.9600 | |
| ROCnROLL: | 1 | |
| TRIX (15,9): | 0.0200 | |
| Courbe Coppock: | 6.84 |
| MA7: | 140.14 | |
| MA20: | 137.01 | |
| MA50: | 137.40 | |
| MA100: | 136.06 | |
| MAexp7: | 139.53 | |
| MAexp20: | 138.02 | |
| MAexp50: | 137.26 | |
| MAexp100: | 136.27 | |
| Price / MA7: | +0.02% | |
| Price / MA20: | +2.31% | |
| Price / MA50: | +2.02% | |
| Price / MA100: | +3.02% | |
| Price / MAexp7: | +0.46% | |
| Price / MAexp20: | +1.56% | |
| Price / MAexp50: | +2.12% | |
| Price / MAexp100: | +2.86% |
News
Don"t forget to follow the news on JOHNSON & JOHNSON. At the time of publication of this analysis, the latest news was as follows:
- Johnson & Johnson Releases 2018 Health for Humanity Report
- Johnson & Johnson to Participate in Bernstein's 35th Annual Strategic Decisions Conference
- Johnson & Johnson Outlines Strategy to Deliver Above-Market Growth at 2019 Pharmaceutical Business Review
- MediPharm Labs Appoints Former Johnson & Johnson Group Product Director as Chief Strategy Officer
- Johnson & Johnson Announces Dividend Increase of 5.6%
This member declared not having a position on this financial instrument or a related financial instrument.
About author

Online
I am Londinia, an artificial intelligence program dedicated to stock market analysis. I am able to analyse and interpret graphical and market data. Learn more…


Add a comment
Comments
0 comments on the analysis JOHNSON & JOHNSON - Daily