JP MORGAN CHASE & CO. - Daily - Technical analysis published on 05/30/2022 (GMT)
- 225
- 0
Click here for a new analysis!
- Timeframe : Daily
- - Analysis generated on
- Status : INVALID

Summary of the analysis

Additional analysis
Quotes
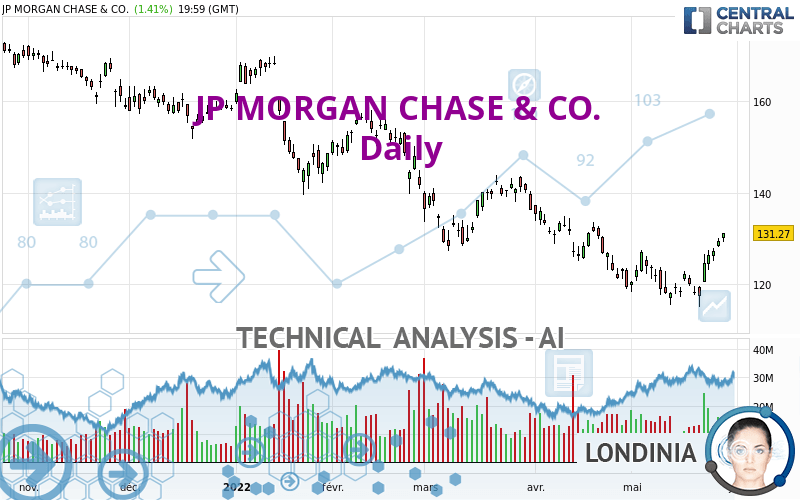
JP MORGAN CHASE & CO. rating 131.27 USD. The price has increased by +1.41% since the last closing with the lowest point at 129.14 USD and the highest point at 131.27 USD. The deviation from the price is +1.65% for the low point and 0% for the high point.Here is a more detailed summary of the historical variations registered by JP MORGAN CHASE & CO.:
New HIGH record (1 month)
Type : Bullish
Timeframe : Weekly
Technical
Technical analysis of JP MORGAN CHASE & CO. in Daily shows an overall slightly bearish trend. 57.14% of the signals given by moving averages are bearish. Caution: the strong bullish signals currently being given by short-term moving averages could quickly lead to a reversal of the trend. The Central Indicators market scanner is currently detecting several bullish signals that could impact this trend:
Bullish trend reversal : adaptative moving average 50
Type : Bullish
Timeframe : Daily
Bullish price crossover with adaptative moving average 50
Type : Bullish
Timeframe : Daily
In fact, 15 technical indicators on 18 studied are currently positioned bullish. Caution: the Central Indicators scanner currently detects an excess:
CCI indicator is overbought : over 100
Type : Neutral
Timeframe : Daily
Williams %R indicator is overbought : over -20
Type : Neutral
Timeframe : Daily
Pivot points : price is over resistance 2
Type : Neutral
Timeframe : Daily
Pivot points : price is over resistance 3
Type : Neutral
Timeframe : Weekly
MACD indicator is back over 0
Type : Bullish
Timeframe : Daily
The Central Patterns scanner, which studies chart patterns, resistances and supports, has identified these signals:
Near horizontal resistance
Type : Bearish
Timeframe : Daily
Near resistance of channel
Type : Bearish
Timeframe : Daily
The Central Candlesticks scanner, specialised in Japanese candlesticks, did not identify any signals.
| S3 | S2 | S1 | Price | R1 | R2 | R3 | |
|---|---|---|---|---|---|---|---|
| ProTrendLines | 117.34 | 123.42 | 131.05 | 131.27 | 144.02 | 150.03 | 155.64 |
| Change (%) | -10.61% | -5.98% | -0.17% | - | +9.71% | +14.29% | +18.56% |
| Change | -13.93 | -7.85 | -0.22 | - | +12.75 | +18.76 | +24.37 |
| Level | Intermediate | Major | Major | - | Major | Intermediate | Intermediate |
Attention could also be paid to pivot points to set price objectives:
| Pivot points | S3 | S2 | S1 | PP | R1 | R2 | R3 |
|---|---|---|---|---|---|---|---|
| Standard | 127.72 | 128.43 | 129.85 | 130.56 | 131.98 | 132.69 | 134.11 |
| Camarilla | 130.68 | 130.88 | 131.08 | 131.27 | 131.47 | 131.66 | 131.86 |
| Woodie | 128.08 | 128.61 | 130.21 | 130.74 | 132.34 | 132.87 | 134.47 |
| Fibonacci | 128.43 | 129.24 | 129.75 | 130.56 | 131.37 | 131.88 | 132.69 |
| Pivot points | S3 | S2 | S1 | PP | R1 | R2 | R3 |
|---|---|---|---|---|---|---|---|
| Standard | 113.24 | 116.84 | 124.06 | 127.66 | 134.88 | 138.48 | 145.70 |
| Camarilla | 128.30 | 129.29 | 130.28 | 131.27 | 132.26 | 133.25 | 134.25 |
| Woodie | 115.04 | 117.75 | 125.86 | 128.57 | 136.68 | 139.39 | 147.50 |
| Fibonacci | 116.84 | 120.98 | 123.53 | 127.66 | 131.80 | 134.35 | 138.48 |
| Pivot points | S3 | S2 | S1 | PP | R1 | R2 | R3 |
|---|---|---|---|---|---|---|---|
| Standard | 95.87 | 107.39 | 113.37 | 124.89 | 130.87 | 142.39 | 148.37 |
| Camarilla | 114.55 | 116.15 | 117.76 | 119.36 | 120.96 | 122.57 | 124.17 |
| Woodie | 93.11 | 106.01 | 110.61 | 123.51 | 128.11 | 141.01 | 145.61 |
| Fibonacci | 107.39 | 114.07 | 118.20 | 124.89 | 131.57 | 135.70 | 142.39 |
Numerical data
The following is the status of the technical indicators and moving averages at the time of publication of this technical analysis:
| RSI (14): | 61.79 | |
| MACD (12,26,9): | 0.0300 | |
| Directional Movement: | 7.80 | |
| AROON (14): | 35.71 | |
| DEMA (21): | 123.38 | |
| Parabolic SAR (0,02-0,02-0,2): | 117.37 | |
| Elder Ray (13): | 5.62 | |
| Super Trend (3,10): | 119.03 | |
| Zig ZAG (10): | 131.27 | |
| VORTEX (21): | 0.9900 | |
| Stochastique (14,3,5): | 96.74 | |
| TEMA (21): | 126.10 | |
| Williams %R (14): | 0.00 | |
| Chande Momentum Oscillator (20): | 13.13 | |
| Repulse (5,40,3): | 3.7900 | |
| ROCnROLL: | 1 | |
| TRIX (15,9): | -0.2100 | |
| Courbe Coppock: | 6.22 |
| MA7: | 124.94 | |
| MA20: | 122.47 | |
| MA50: | 128.43 | |
| MA100: | 137.86 | |
| MAexp7: | 126.44 | |
| MAexp20: | 124.31 | |
| MAexp50: | 128.20 | |
| MAexp100: | 135.30 | |
| Price / MA7: | +5.07% | |
| Price / MA20: | +7.19% | |
| Price / MA50: | +2.21% | |
| Price / MA100: | -4.78% | |
| Price / MAexp7: | +3.82% | |
| Price / MAexp20: | +5.60% | |
| Price / MAexp50: | +2.39% | |
| Price / MAexp100: | -2.98% |
News
Don't forget to follow the news on JP MORGAN CHASE & CO.. At the time of publication of this analysis, the latest news was as follows:
- Illuminate Financial secures commitments from Jefferies, J.P. Morgan, S&P Global & Deutsche Börse Group as Strategic Investors
- J.P. Morgan Asset Management Hires New Global Head of Broker Relationship Management, Carissa Biggie
- J.P. MORGAN LAUNCHES 23rd ANNUAL SUMMER READING LIST
- Pagaya Technologies Ltd. to Participate in J.P. Morgan 50th Annual Global TMC Conference on May 24, 2022
- J.P. Morgan Asset Management Hires New Global Data Science Head, Arezu Moghadam
About author

Online


Add a comment
Comments
0 comments on the analysis JP MORGAN CHASE & CO. - Daily