JUNIPER NETWORKS INC. - Daily - Technical analysis published on 10/25/2019 (GMT)
- Who voted?
- 245
- 0
Click here for a new analysis!
- Timeframe : Daily
- - Analysis generated on
- Status : TARGET REACHED

Summary of the analysis

Additional analysis
Quotes
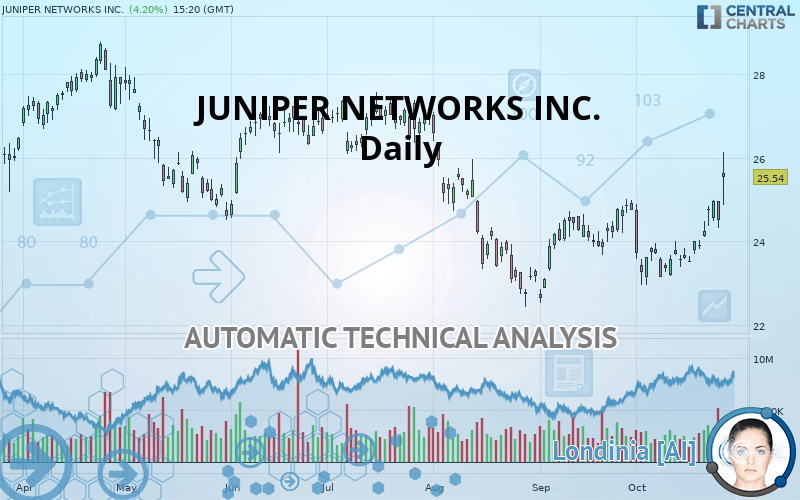
The JUNIPER NETWORKS INC. rating is 25.54 USD. On the day, this instrument gained +4.20% and was traded between 24.87 USD and 26.14 USD over the period. The price is currently at +2.69% from its lowest and -2.30% from its highest.The Central Gaps scanner detects a bullish gap which is a sign that buyers have taken the lead in the very short term.
Opening Gap UP
Type : Bullish
Timeframe : Openning
So that you have an overall view of the price change, here is a table showing the variations over several periods:
Technical
Technical analysis of this Daily chart of JUNIPER NETWORKS INC. indicates that the overall trend is bullish. 64.29% of the signals given by moving averages are bullish. This bullish trend is supported by the strong bullish signals given by short-term moving averages. The Central Indicators market scanner is currently detecting several bearish and bullish signals that could impact this trend:
Bullish trend reversal : Moving Average 50
Type : Bullish
Timeframe : Daily
Bearish trend reversal : Moving Average 100
Type : Bearish
Timeframe : Daily
Bearish price crossover with adaptative moving average 100
Type : Bearish
Timeframe : Daily
Technical indicators are strongly bullish, suggesting that the price increase should continue.
Caution: the Central Indicators scanner currently detects an excess:
Williams %R indicator is overbought : over -20
Type : Neutral
Timeframe : Daily
Pivot points : price is over resistance 2
Type : Neutral
Timeframe : Daily
Pivot points : price is over resistance 3
Type : Neutral
Timeframe : Weekly
Price is back under the pivot point
Type : Bearish
Timeframe : Daily
Central Patterns, the market scanner focusing on chart patterns, resistances and supports found this result:
Resistance of channel is broken
Type : Bullish
Timeframe : Daily
The presence of a bearish pattern in Japanese candlesticks detected by Central Candlesticks that could cause a correction in the very short term was also detected:
Bearish engulfing lines
Type : Bearish
Timeframe : Daily
| S3 | S2 | S1 | Price | R1 | R2 | R3 | |
|---|---|---|---|---|---|---|---|
| ProTrendLines | 23.15 | 24.13 | 24.87 | 25.54 | 25.69 | 27.38 | 28.70 |
| Change (%) | -9.36% | -5.52% | -2.62% | - | +0.59% | +7.20% | +12.37% |
| Change | -2.39 | -1.41 | -0.67 | - | +0.15 | +1.84 | +3.16 |
| Level | Intermediate | Major | Major | - | Minor | Major | Intermediate |
Pivot points can also be used to set your price objectives. Here is the price situation in relation to pivot points:
| Pivot points | S3 | S2 | S1 | PP | R1 | R2 | R3 |
|---|---|---|---|---|---|---|---|
| Standard | 23.57 | 23.94 | 24.23 | 24.60 | 24.88 | 25.25 | 25.54 |
| Camarilla | 24.33 | 24.39 | 24.45 | 24.51 | 24.57 | 24.63 | 24.69 |
| Woodie | 23.53 | 23.92 | 24.18 | 24.58 | 24.84 | 25.23 | 25.49 |
| Fibonacci | 23.94 | 24.19 | 24.35 | 24.60 | 24.85 | 25.00 | 25.25 |
| Pivot points | S3 | S2 | S1 | PP | R1 | R2 | R3 |
|---|---|---|---|---|---|---|---|
| Standard | 22.89 | 23.14 | 23.52 | 23.77 | 24.15 | 24.40 | 24.78 |
| Camarilla | 23.73 | 23.79 | 23.84 | 23.90 | 23.96 | 24.02 | 24.07 |
| Woodie | 22.96 | 23.17 | 23.59 | 23.80 | 24.22 | 24.43 | 24.85 |
| Fibonacci | 23.14 | 23.38 | 23.53 | 23.77 | 24.01 | 24.16 | 24.40 |
| Pivot points | S3 | S2 | S1 | PP | R1 | R2 | R3 |
|---|---|---|---|---|---|---|---|
| Standard | 20.68 | 21.60 | 23.17 | 24.09 | 25.66 | 26.58 | 28.15 |
| Camarilla | 24.07 | 24.29 | 24.52 | 24.75 | 24.98 | 25.21 | 25.44 |
| Woodie | 21.02 | 21.76 | 23.51 | 24.25 | 26.00 | 26.74 | 28.49 |
| Fibonacci | 21.60 | 22.55 | 23.14 | 24.09 | 25.04 | 25.63 | 26.58 |
Numerical data
The following are the details of the technical indicators and moving averages that were collected to generate this technical analysis:
| RSI (14): | 65.83 | |
| MACD (12,26,9): | 0.2200 | |
| Directional Movement: | 22.43 | |
| AROON (14): | 92.86 | |
| DEMA (21): | 24.40 | |
| Parabolic SAR (0,02-0,02-0,2): | 23.28 | |
| Elder Ray (13): | 1.16 | |
| Super Trend (3,10): | 23.75 | |
| Zig ZAG (10): | 25.43 | |
| VORTEX (21): | 0.9600 | |
| Stochastique (14,3,5): | 83.29 | |
| TEMA (21): | 24.72 | |
| Williams %R (14): | -21.74 | |
| Chande Momentum Oscillator (20): | 2.15 | |
| Repulse (5,40,3): | -0.2400 | |
| ROCnROLL: | 1 | |
| TRIX (15,9): | 0.0100 | |
| Courbe Coppock: | 6.88 |
| MA7: | 24.56 | |
| MA20: | 23.96 | |
| MA50: | 23.86 | |
| MA100: | 25.06 | |
| MAexp7: | 24.66 | |
| MAexp20: | 24.22 | |
| MAexp50: | 24.28 | |
| MAexp100: | 24.76 | |
| Price / MA7: | +3.99% | |
| Price / MA20: | +6.59% | |
| Price / MA50: | +7.04% | |
| Price / MA100: | +1.92% | |
| Price / MAexp7: | +3.57% | |
| Price / MAexp20: | +5.45% | |
| Price / MAexp50: | +5.19% | |
| Price / MAexp100: | +3.15% |
News
Don"t forget to follow the news on JUNIPER NETWORKS INC.. At the time of publication of this analysis, the latest news was as follows:
- Juniper Networks Announces Increased Stock Buyback Authorization
- Juniper Networks Reports Preliminary Third Quarter 2019 Financial Results
- Juniper Networks Builds Secure, Automated and Cloud-Enabled Network Infrastructure with Telefónica UK
- Juniper Networks (Mist Systems) Named a Visionary in Gartner Magic Quadrant for Wired and Wireless LAN Access Infrastructure
- Juniper Networks Releases 2019 State of Network Automation Report
About author

Online


Add a comment
Comments
0 comments on the analysis JUNIPER NETWORKS INC. - Daily