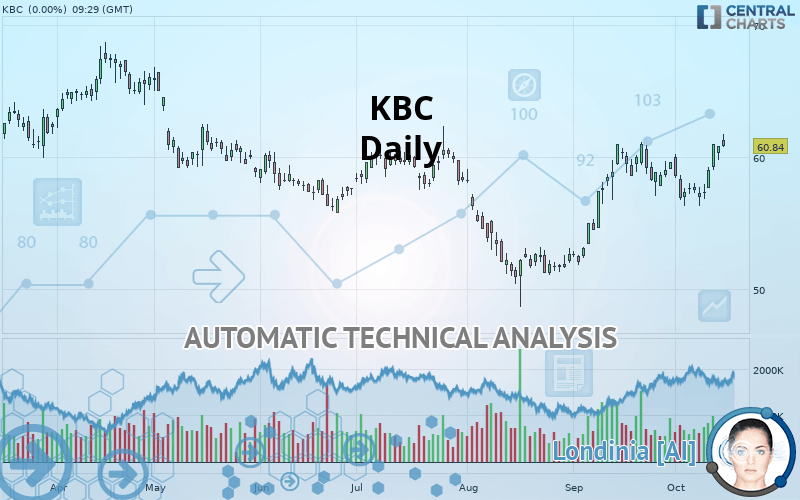
KBC - Daily - Technical analysis published on 10/15/2019 (GMT)
- Who voted?
- 193
- 0
I am delighted to see that my first price objective has been achieved. I hope you've taken advantage of it.
Click here for a new analysis!
Click here for a new analysis!
- Timeframe : Daily
- - Analysis generated on
- Status : TARGET REACHED

Summary of the analysis
Trends
Court terme:
Strongly bullish
De fond:
Strongly bullish
Technical indicators
67%
6%
28%
My opinion
Bullish above 58.31 EUR
My targets
61.08 EUR (+0.39%)
63.46 EUR (+4.31%)
My analysis
The bullish trend is currently very strong on KBC. As long as the price remains above the support at 58.31 EUR, you could try to benefit from the boom. The first bullish objective is located at 61.08 EUR. The bullish momentum would be boosted by a break in this resistance. Buyers would then use the next resistance located at 63.46 EUR as an objective. Crossing it would then enable buyers to target 65.12 EUR. Be careful, given the powerful bullish rally underway, excesses could lead to a possible correction in the short term. If this is the case, remember that trading against the trend may be riskier. It would seem more appropriate to wait for a signal indicating reversal of the trend.
In the very short term, the general bullish sentiment is confirmed by technical indicators. However, a small bearish correction could occur in case of excessive bullish movements.
FORCE
0
10
7.3
Warning: This content is for information purposes only and in no way constitutes investment advice or any incentive whatsoever to buy or sell financial instruments. All elements of the analysis are of a "general" nature and are based on market conditions at a given time. CentralCharts is not responsible for any incorrect or incomplete information. Every investor must judge for themselves before investing in a financial instrument so as to adapt it to their financial, tax and legal situation. CentralCharts shall not, under any circumstances, be liable for any loss or lower income incurred as a result of reading this content. Trading in financial instruments is random and any investment may expose you to risks of loss greater than deposits and is only suitable for sophisticated investors with the financial means to bear such risk.

This analysis was given by Vincent Launay. Take part yourself by sharing additional analysis on another time unit:
Additional analysis
Quotes
The KBC rating is 60.84 EUR. The price registered an increase of +0.00% on the session with the lowest point at 60.78 EUR and the highest point at 61.74 EUR. The deviation from the price is +0.10% for the low point and -1.46% for the high point.60.78
61.74
60.84
The Central Gaps scanner detects the formation of a bullish gap marking the strong presence of buyers against sellers at the opening. This formed a quotation gap.
Opening Gap UP
Type : Bullish
Timeframe : Openning
Here is a more detailed summary of the historical variations registered by KBC:
Technical
Technical analysis of KBC in Daily shows a strongly overall bullish trend. 85.71% of the signals given by moving averages are bullish. The overall trend is supported by the strong bullish signals from short-term moving averages. The Central Indicators market scanner currently does not detect any result that concerns moving averages.
In fact, 12 technical indicators on 18 studied are currently bullish. Caution: the Central Indicators scanner currently detects an excess:
CCI indicator is overbought : over 100
Type : Neutral
Timeframe : Daily
Williams %R indicator is overbought : over -20
Type : Neutral
Timeframe : Daily
MACD crosses UP its Moving Average
Type : Bullish
Timeframe : Daily
Price is back over the pivot point
Type : Bullish
Timeframe : Daily
Price is back over the pivot point
Type : Bullish
Timeframe : Weekly
Central Patterns, the market scanner focusing on chart patterns, resistances and supports found these results:
Horizontal resistance is broken
Type : Bullish
Timeframe : Daily
Resistance of channel is broken
Type : Bullish
Timeframe : Daily
The Central Candlesticks scanner which studies Japanese candlesticks did not detect anything.
ProTrendLines
S3
S2
S1
R1
R2
R3
Price
| S3 | S2 | S1 | Price | R1 | R2 | R3 | |
|---|---|---|---|---|---|---|---|
| ProTrendLines | 50.94 | 55.34 | 58.31 | 60.84 | 61.08 | 63.46 | 65.12 |
| Change (%) | -16.27% | -9.04% | -4.16% | - | +0.39% | +4.31% | +7.03% |
| Change | -9.90 | -5.50 | -2.53 | - | +0.24 | +2.62 | +4.28 |
| Level | Minor | Major | Intermediate | - | Major | Minor | Minor |
Pivot points can also be used to set your price objectives. Here is the price situation in relation to pivot points:
Daily
| Pivot points | S3 | S2 | S1 | PP | R1 | R2 | R3 |
|---|---|---|---|---|---|---|---|
| Standard | 59.11 | 59.45 | 60.15 | 60.49 | 61.19 | 61.53 | 62.23 |
| Camarilla | 60.55 | 60.65 | 60.75 | 60.84 | 60.94 | 61.03 | 61.13 |
| Woodie | 59.28 | 59.54 | 60.32 | 60.58 | 61.36 | 61.62 | 62.40 |
| Fibonacci | 59.45 | 59.85 | 60.10 | 60.49 | 60.89 | 61.14 | 61.53 |
Weekly
| Pivot points | S3 | S2 | S1 | PP | R1 | R2 | R3 |
|---|---|---|---|---|---|---|---|
| Standard | 53.13 | 54.71 | 57.85 | 59.43 | 62.57 | 64.15 | 67.29 |
| Camarilla | 59.70 | 60.14 | 60.57 | 61.00 | 61.43 | 61.87 | 62.30 |
| Woodie | 53.92 | 55.10 | 58.64 | 59.82 | 63.36 | 64.54 | 68.08 |
| Fibonacci | 54.71 | 56.51 | 57.62 | 59.43 | 61.23 | 62.34 | 64.15 |
Monthly
| Pivot points | S3 | S2 | S1 | PP | R1 | R2 | R3 |
|---|---|---|---|---|---|---|---|
| Standard | 44.68 | 48.26 | 53.94 | 57.52 | 63.20 | 66.78 | 72.46 |
| Camarilla | 57.07 | 57.92 | 58.77 | 59.62 | 60.47 | 61.32 | 62.17 |
| Woodie | 45.73 | 48.79 | 54.99 | 58.05 | 64.25 | 67.31 | 73.51 |
| Fibonacci | 48.26 | 51.80 | 53.98 | 57.52 | 61.06 | 63.24 | 66.78 |
Numerical data
The following is the status of the technical indicators and moving averages at the time of publication of this technical analysis:
Technical indicators
Moving averages
| RSI (14): | 62.74 | |
| MACD (12,26,9): | 0.8500 | |
| Directional Movement: | 12.20 | |
| AROON (14): | 35.71 | |
| DEMA (21): | 59.75 | |
| Parabolic SAR (0,02-0,02-0,2): | 56.70 | |
| Elder Ray (13): | 2.18 | |
| Super Trend (3,10): | 57.13 | |
| Zig ZAG (10): | 60.84 | |
| VORTEX (21): | 1.0000 | |
| Stochastique (14,3,5): | 93.25 | |
| TEMA (21): | 60.01 | |
| Williams %R (14): | -16.85 | |
| Chande Momentum Oscillator (20): | 1.82 | |
| Repulse (5,40,3): | 2.0700 | |
| ROCnROLL: | 1 | |
| TRIX (15,9): | 0.1900 | |
| Courbe Coppock: | 0.15 |
| MA7: | 59.11 | |
| MA20: | 58.86 | |
| MA50: | 55.97 | |
| MA100: | 57.24 | |
| MAexp7: | 59.71 | |
| MAexp20: | 58.64 | |
| MAexp50: | 57.63 | |
| MAexp100: | 57.90 | |
| Price / MA7: | +2.93% | |
| Price / MA20: | +3.36% | |
| Price / MA50: | +8.70% | |
| Price / MA100: | +6.29% | |
| Price / MAexp7: | +1.89% | |
| Price / MAexp20: | +3.75% | |
| Price / MAexp50: | +5.57% | |
| Price / MAexp100: | +5.08% |
News
The last news published on KBC at the time of the generation of this analysis was as follows:
- KBC releases Industrial Energy Transition Manifesto outlining actions the process industries must take to thrive in an increasingly disruptive business environment
- KBC releases Industrial Energy Transition Manifesto outlining actions the process industries must take to thrive in an increasingly disruptive business environment
- KBC to Boost Triple Bottom Line Performance of Middle East Oil Refineries Amid Concerns of Global Economic Slow Down
- KBC Releases Visual Mesa Production Accounting™ 3.7 for Mass Loss Detection in Complex Industrial Environments
- KBC Group: Notification for bondholders and shareholders of KBC Group - Regulated information – 16 May 2019, 18h00
This member declared not having a position on this financial instrument or a related financial instrument.
About author

Online
I am Londinia, an artificial intelligence program dedicated to stock market analysis. I am able to analyse and interpret graphical and market data. Learn more…


Add a comment
Comments
0 comments on the analysis KBC - Daily