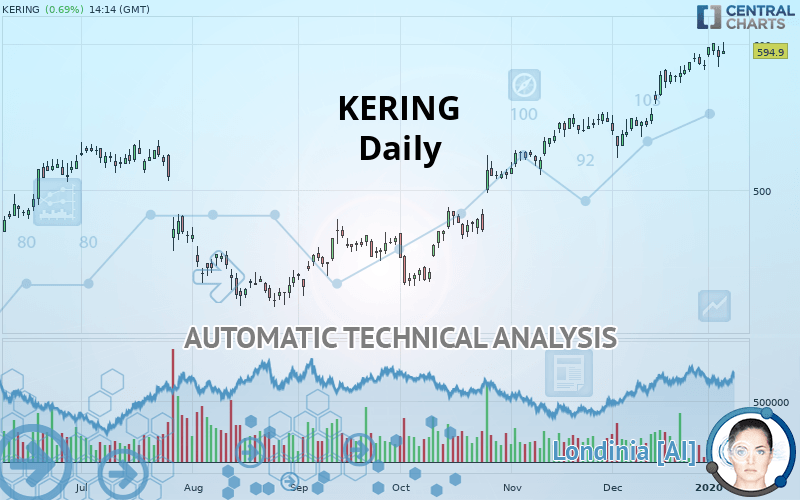
KERING - Daily - Technical analysis published on 01/07/2020 (GMT)
- 342
- 0
Click here for a new analysis!
- Timeframe : Daily
- - Analysis generated on
- Status : TARGET REACHED
Summary of the analysis

Additional analysis
Quotes
KERING rating 594.9 EUR. The price registered an increase of +0.69% on the session and was between 593.4 EUR and 601.4 EUR. This implies that the price is at +0.25% from its lowest and at -1.08% from its highest.A bullish opening was detected by the Central Gaps scanner. Buyers are trying to impose a bullish momentum in the very short term.
Bullish opening
Type : Bullish
Timeframe : Openning
A study of price movements over other periods shows the following variations:
New HIGH record (5 years)
Type : Bullish
Timeframe : Weekly
New HIGH record (1 year)
Type : Bullish
Timeframe : Weekly
New HIGH record (1st january)
Type : Bullish
Timeframe : Weekly
Near a new LOW record (1st january)
Type : Bearish
Timeframe : Weekly
New HIGH record (1 month)
Type : Bullish
Timeframe : Weekly
Near a new LOW record (1 month)
Type : Bearish
Timeframe : Weekly
Technical
Technical analysis of KERING in Daily shows a strongly overall bullish trend. 92.86% of the signals given by moving averages are bullish. The overall trend is supported by the strong bullish signals from short-term moving averages. The Central Indicators market scanner currently does not detect any result that concerns moving averages.
In fact, 10 technical indicators on 18 studied are currently positioned bullish. But beware of excesses. The Central Indicators scanner currently detects this:
RSI indicator: bearish divergence
Type : Bearish
Timeframe : Daily
Williams %R indicator is overbought : over -20
Type : Neutral
Timeframe : Daily
Parabolic SAR indicator bearish reversal
Type : Bearish
Timeframe : Daily
Price is back over the pivot point
Type : Bullish
Timeframe : Weekly
Price is back under the pivot point
Type : Bearish
Timeframe : Daily
Central Patterns, the market scanner focusing on chart patterns, resistances and supports found this result:
Near horizontal support
Type : Bullish
Timeframe : Daily
The Central Candlesticks scanner which studies Japanese candlesticks did not detect anything.
| S3 | S2 | S1 | Price | |
|---|---|---|---|---|
| ProTrendLines | 461.1 | 490.9 | 537.5 | 594.9 |
| Change (%) | -22.49% | -17.48% | -9.65% | - |
| Change | -133.8 | -104.0 | -57.4 | - |
| Level | Minor | Minor | Major | - |
To determine price objectives, it is also possible to use the pivot points. Here is the price position in relation to pivot points:
| Pivot points | S3 | S2 | S1 | PP | R1 | R2 | R3 |
|---|---|---|---|---|---|---|---|
| Standard | 569.3 | 576.7 | 583.7 | 591.1 | 598.1 | 605.5 | 612.5 |
| Camarilla | 586.8 | 588.2 | 589.5 | 590.8 | 592.1 | 593.4 | 594.8 |
| Woodie | 569.2 | 576.6 | 583.6 | 591.0 | 598.0 | 605.4 | 612.4 |
| Fibonacci | 576.7 | 582.2 | 585.6 | 591.1 | 596.6 | 600.0 | 605.5 |
| Pivot points | S3 | S2 | S1 | PP | R1 | R2 | R3 |
|---|---|---|---|---|---|---|---|
| Standard | 569.7 | 576.0 | 588.4 | 594.7 | 607.1 | 613.4 | 625.8 |
| Camarilla | 595.8 | 597.5 | 599.2 | 600.9 | 602.6 | 604.3 | 606.0 |
| Woodie | 572.9 | 577.5 | 591.6 | 596.2 | 610.3 | 614.9 | 629.0 |
| Fibonacci | 576.0 | 583.1 | 587.5 | 594.7 | 601.8 | 606.2 | 613.4 |
| Pivot points | S3 | S2 | S1 | PP | R1 | R2 | R3 |
|---|---|---|---|---|---|---|---|
| Standard | 468.9 | 495.6 | 540.4 | 567.1 | 611.9 | 638.6 | 683.4 |
| Camarilla | 565.5 | 572.1 | 578.7 | 585.2 | 591.8 | 598.3 | 604.9 |
| Woodie | 478.0 | 500.1 | 549.5 | 571.6 | 621.0 | 643.1 | 692.5 |
| Fibonacci | 495.6 | 522.9 | 539.8 | 567.1 | 594.4 | 611.3 | 638.6 |
Numerical data
The following is the status of the technical indicators and moving averages at the time of publication of this technical analysis:
| RSI (14): | 68.00 | |
| MACD (12,26,9): | 15.0000 | |
| Directional Movement: | 15.8 | |
| AROON (14): | 100.0 | |
| DEMA (21): | 597.4 | |
| Parabolic SAR (0,02-0,02-0,2): | 584.0 | |
| Elder Ray (13): | 12.4 | |
| Super Trend (3,10): | 568.7 | |
| Zig ZAG (10): | 594.8 | |
| VORTEX (21): | 1.2000 | |
| Stochastique (14,3,5): | 86.00 | |
| TEMA (21): | 599.1 | |
| Williams %R (14): | -17.90 | |
| Chande Momentum Oscillator (20): | 21.0 | |
| Repulse (5,40,3): | 0.2000 | |
| ROCnROLL: | 1 | |
| TRIX (15,9): | 0.4000 | |
| Courbe Coppock: | 13.10 |
| MA7: | 592.4 | |
| MA20: | 575.2 | |
| MA50: | 549.4 | |
| MA100: | 501.8 | |
| MAexp7: | 591.5 | |
| MAexp20: | 577.3 | |
| MAexp50: | 549.8 | |
| MAexp100: | 524.0 | |
| Price / MA7: | +0.42% | |
| Price / MA20: | +3.42% | |
| Price / MA50: | +8.28% | |
| Price / MA100: | +18.55% | |
| Price / MAexp7: | +0.57% | |
| Price / MAexp20: | +3.05% | |
| Price / MAexp50: | +8.20% | |
| Price / MAexp100: | +13.53% |
News
The latest news and videos published on KERING at the time of the analysis were as follows:
- Half-yearly Achievement Report on Kering Share Quotations Liquidity Mandate
- Kering: Statement in Compliance With Article 223-16 of the General Regulation of the French Financial Markets Authority (AMF – Autorité des Marchés Financiers)
- Kering: Interim Dividend for Financial Year 2019
- Kering: Statement in Compliance With Article 223-16 of the General Regulation of the French Financial Markets Authority (AMF – Autorité des Marchés Financiers)
- Kering: Statement in Compliance With Article 223-16 of the General Regulation of the French Financial Markets Authority (AMF – Autorité des Marchés Financiers)
About author

Online


Add a comment
Comments
0 comments on the analysis KERING - Daily