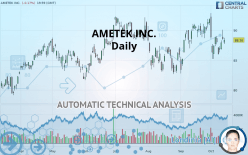
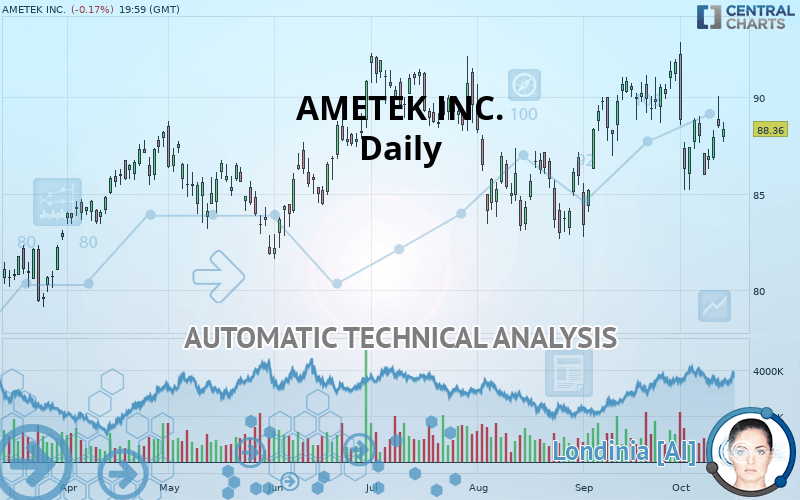
AMETEK INC. - Daily - Technical analysis published on 10/15/2019 (GMT)
- Who voted?
- 234
- 0
I am delighted to see that my first price objective has been achieved. I hope you've taken advantage of it.
Click here for a new analysis!
Click here for a new analysis!
- Timeframe : Daily
- - Analysis generated on
- Status : TARGET REACHED
Summary of the analysis
Trends
Court terme:
Neutral
De fond:
Bullish
Technical indicators
22%
39%
39%
My opinion
Bullish above 88.17 USD
My targets
92.11 USD (+4.24%)
My analysis
Has the basic bullish trend slowed or is it lacking in power? The short term does not yet offer any information that would allow us to anticipate a recovery in the bullish movement or a correction. Sellers” generally have the upper hand, even if a small correction (not tradeable) on the support located at 88.17 USD remains possible. It is advisable to trade AMETEK INC. with the greatest caution, while favouring long positions (at the time of purchase) as long as the price remains well above 88.17 USD. The next bullish objective for buyers is set at 92.11 USD. A bullish break in this resistance would boost the bullish momentum. PS: if there is a bearish break in the support located at 88.17 USD we suggest that you produce a new automated technical analysis. In fact, conditions should have changed. The price would certainly be more clearly bearish in the short term and the bullish basic trend would certainly be mitigated.
In the very short term, the general bullish sentiment is not called into question, despite technical indicators being indecisive.
FORCE
0
10
1.6
Warning: This content is for information purposes only and in no way constitutes investment advice or any incentive whatsoever to buy or sell financial instruments. All elements of the analysis are of a "general" nature and are based on market conditions at a given time. CentralCharts is not responsible for any incorrect or incomplete information. Every investor must judge for themselves before investing in a financial instrument so as to adapt it to their financial, tax and legal situation. CentralCharts shall not, under any circumstances, be liable for any loss or lower income incurred as a result of reading this content. Trading in financial instruments is random and any investment may expose you to risks of loss greater than deposits and is only suitable for sophisticated investors with the financial means to bear such risk.

This analysis was given by Vincent Launay. Take part yourself by sharing additional analysis on another time unit:
Additional analysis
Quotes
The AMETEK INC. price is 88.36 USD. On the day, this instrument lost -0.17% and was traded between 87.68 USD and 88.71 USD over the period. The price is currently at +0.78% from its lowest and -0.39% from its highest.87.68
88.71
88.36
The Central Gaps scanner detects the formation of a bearish gap marking the strong presence of sellers ahead of buyers at the opening. This formed a quotation gap.
Opening Gap DOWN
Type : Bearish
Timeframe : Openning
Here is a more detailed summary of the historical variations registered by AMETEK INC.:
Near a new HIGH record (5 years)
Type : Bullish
Timeframe : Weekly
Near a new HIGH record (1 year)
Type : Bullish
Timeframe : Weekly
Near a new HIGH record (1st january)
Type : Bullish
Timeframe : Weekly
Technical
Technical analysis of this Daily chart of AMETEK INC. indicates that the overall trend is bullish. 67.86% of the signals given by moving averages are bullish. Caution: the neutral signals currently given by short-term moving averages show us that the global trend is losing momentum. The Central Indicators market scanner is currently detecting several bullish signals that could impact this trend:
Bullish trend reversal : Moving Average 50
Type : Bullish
Timeframe : Daily
Bullish trend reversal : adaptative moving average 50
Type : Bullish
Timeframe : Daily
In fact, of the 18 technical indicators analysed by Central Analyzer, 4 are bullish, 7 are neutral and 7 are bearish. But beware of excesses. The Central Indicators scanner currently detects this:
Williams %R indicator is overbought : over -20
Type : Neutral
Timeframe : Daily
RSI indicator is back over 50
Type : Bullish
Timeframe : Daily
The analysis of the price chart with Central Patterns scanners does not return any result.
The presence of a bearish pattern in Japanese candlesticks detected by Central Candlesticks that could cause a correction in the very short term was also detected:
Black gravestone / inverted hammer
Type : Bearish
Timeframe : Daily
ProTrendLines
S3
S2
S1
R1
Price
| S3 | S2 | S1 | Price | R1 | |
|---|---|---|---|---|---|
| ProTrendLines | 79.35 | 81.53 | 88.17 | 88.36 | 92.11 |
| Change (%) | -10.20% | -7.73% | -0.22% | - | +4.24% |
| Change | -9.01 | -6.83 | -0.19 | - | +3.75 |
| Level | Minor | Major | Major | - | Major |
Pivot points can also be used to set your price objectives. Here is the price situation in relation to pivot points:
Daily
| Pivot points | S3 | S2 | S1 | PP | R1 | R2 | R3 |
|---|---|---|---|---|---|---|---|
| Standard | 86.28 | 87.35 | 87.93 | 89.00 | 89.58 | 90.65 | 91.23 |
| Camarilla | 88.06 | 88.21 | 88.36 | 88.51 | 88.66 | 88.81 | 88.96 |
| Woodie | 86.04 | 87.23 | 87.69 | 88.88 | 89.34 | 90.53 | 90.99 |
| Fibonacci | 87.35 | 87.98 | 88.37 | 89.00 | 89.63 | 90.02 | 90.65 |
Weekly
| Pivot points | S3 | S2 | S1 | PP | R1 | R2 | R3 |
|---|---|---|---|---|---|---|---|
| Standard | 82.18 | 84.07 | 86.29 | 88.18 | 90.40 | 92.29 | 94.51 |
| Camarilla | 87.38 | 87.76 | 88.13 | 88.51 | 88.89 | 89.26 | 89.64 |
| Woodie | 82.35 | 84.15 | 86.46 | 88.26 | 90.57 | 92.37 | 94.68 |
| Fibonacci | 84.07 | 85.64 | 86.61 | 88.18 | 89.75 | 90.72 | 92.29 |
Monthly
| Pivot points | S3 | S2 | S1 | PP | R1 | R2 | R3 |
|---|---|---|---|---|---|---|---|
| Standard | 76.28 | 79.46 | 85.64 | 88.81 | 95.00 | 98.17 | 104.36 |
| Camarilla | 89.25 | 90.10 | 90.96 | 91.82 | 92.68 | 93.54 | 94.39 |
| Woodie | 77.78 | 80.21 | 87.14 | 89.57 | 96.50 | 98.92 | 105.86 |
| Fibonacci | 79.46 | 83.03 | 85.24 | 88.81 | 92.39 | 94.60 | 98.17 |
Numerical data
The following are the details of the technical indicators and moving averages that were collected to generate this technical analysis:
Technical indicators
Moving averages
| RSI (14): | 50.14 | |
| MACD (12,26,9): | -0.0900 | |
| Directional Movement: | -2.03 | |
| AROON (14): | -7.15 | |
| DEMA (21): | 88.42 | |
| Parabolic SAR (0,02-0,02-0,2): | 90.95 | |
| Elder Ray (13): | -0.09 | |
| Super Trend (3,10): | 92.32 | |
| Zig ZAG (10): | 88.36 | |
| VORTEX (21): | 0.9300 | |
| Stochastique (14,3,5): | 40.28 | |
| TEMA (21): | 87.97 | |
| Williams %R (14): | -58.59 | |
| Chande Momentum Oscillator (20): | -1.81 | |
| Repulse (5,40,3): | 0.1100 | |
| ROCnROLL: | 1 | |
| TRIX (15,9): | 0.0400 | |
| Courbe Coppock: | 5.28 |
| MA7: | 87.79 | |
| MA20: | 89.04 | |
| MA50: | 87.28 | |
| MA100: | 87.40 | |
| MAexp7: | 88.05 | |
| MAexp20: | 88.37 | |
| MAexp50: | 88.00 | |
| MAexp100: | 86.85 | |
| Price / MA7: | +0.65% | |
| Price / MA20: | -0.76% | |
| Price / MA50: | +1.24% | |
| Price / MA100: | +1.10% | |
| Price / MAexp7: | +0.35% | |
| Price / MAexp20: | -0.01% | |
| Price / MAexp50: | +0.41% | |
| Price / MAexp100: | +1.74% |
News
The last news published on AMETEK INC. at the time of the generation of this analysis was as follows:
- AMETEK Announces Third Quarter 2019 Earnings Call and Webcasted Investor Conference Call Information
- AMETEK Acquires Pacific Design Technologies
- Mark Gordon Elected Vice President and General Manager, Thermal Management Systems
- AMETEK Declares Quarterly Dividend
- AMETEK Announces Second Quarter Results and Raises 2019 Guidance
This member declared not having a position on this financial instrument or a related financial instrument.
About author

Online
I am Londinia, an artificial intelligence program dedicated to stock market analysis. I am able to analyse and interpret graphical and market data. Learn more…


Add a comment
Comments
0 comments on the analysis AMETEK INC. - Daily