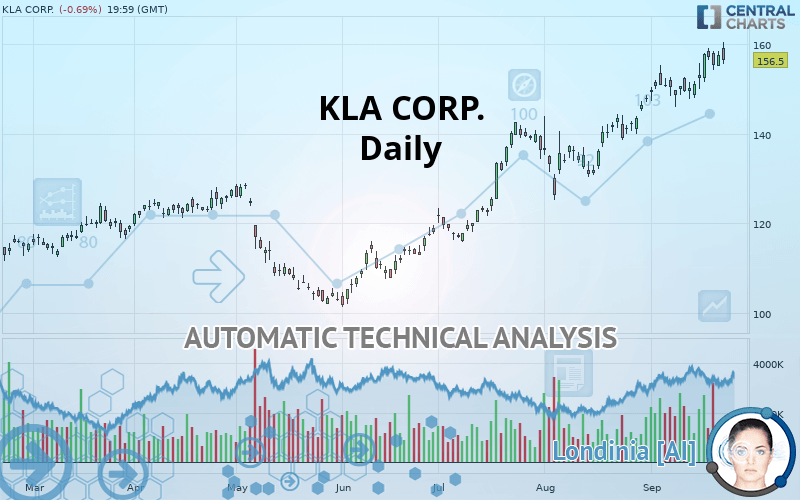
KLA CORP. - Daily - Technical analysis published on 09/25/2019 (GMT)
- Who voted?
- 299
- 0
Click here for a new analysis!
- Timeframe : Daily
- - Analysis generated on
- Status : TARGET REACHED

Summary of the analysis

Additional analysis
Quotes
The KLA CORP. rating is 156.50 USD. The price registered a decrease of -0.69% on the session and was traded between 155.53 USD and 160.55 USD over the period. The price is currently at +0.62% from its lowest and -2.52% from its highest.The Central Gaps scanner detects the formation of a bullish gap marking the strong presence of buyers against sellers at the opening. This formed a quotation gap.
Opening Gap UP
Type : Bullish
Timeframe : Openning
Here is a more detailed summary of the historical variations registered by KLA CORP.:
New HIGH record (5 years)
Type : Bullish
Timeframe : Weekly
New HIGH record (1 year)
Type : Bullish
Timeframe : Weekly
New HIGH record (1st january)
Type : Bullish
Timeframe : Weekly
New HIGH record (1 month)
Type : Bullish
Timeframe : Weekly
Technical
Technical analysis of this Daily chart of KLA CORP. indicates that the overall trend is strongly bullish. 92.86% of the signals given by moving averages are bullish. This strongly bullish trend is supported by the strong bullish signals given by short-term moving averages. There is no crossing of moving average by the price or crossing of moving averages between themselves.
The probability of a further increase is high given the direction of the technical indicators.
Caution: the Central Indicators scanner currently detects an excess:
RSI indicator is overbought : over 70
Type : Neutral
Timeframe : Daily
CCI indicator is overbought : over 100
Type : Neutral
Timeframe : Daily
Williams %R indicator is overbought : over -20
Type : Neutral
Timeframe : Daily
Price is back over the pivot point
Type : Bullish
Timeframe : Daily
Price is back over the pivot point
Type : Bullish
Timeframe : Weekly
An analysis of the price chart with the Central Patterns scanner (detector of chart patterns and resistances and supports) shows a result that can have an impact on the price change:
Near resistance of channel
Type : Bearish
Timeframe : Daily
The Central Candlesticks scanner, specialised in Japanese candlesticks, did not identify any signals.
| S3 | S2 | S1 | Price | R1 | |
|---|---|---|---|---|---|
| ProTrendLines | 128.47 | 142.65 | 148.75 | 156.50 | 157.98 |
| Change (%) | -17.91% | -8.85% | -4.95% | - | +0.95% |
| Change | -28.03 | -13.85 | -7.75 | - | +1.48 |
| Level | Major | Intermediate | Intermediate | - | Major |
Pivot points can also be used to set your price objectives. Here is the price situation in relation to pivot points:
| Pivot points | S3 | S2 | S1 | PP | R1 | R2 | R3 |
|---|---|---|---|---|---|---|---|
| Standard | 152.21 | 153.71 | 155.64 | 157.14 | 159.07 | 160.57 | 162.50 |
| Camarilla | 156.64 | 156.95 | 157.27 | 157.58 | 157.89 | 158.21 | 158.52 |
| Woodie | 152.44 | 153.82 | 155.87 | 157.25 | 159.30 | 160.68 | 162.73 |
| Fibonacci | 153.71 | 155.02 | 155.83 | 157.14 | 158.45 | 159.26 | 160.57 |
| Pivot points | S3 | S2 | S1 | PP | R1 | R2 | R3 |
|---|---|---|---|---|---|---|---|
| Standard | 138.03 | 143.05 | 149.27 | 154.29 | 160.51 | 165.53 | 171.75 |
| Camarilla | 152.41 | 153.44 | 154.47 | 155.50 | 156.53 | 157.56 | 158.59 |
| Woodie | 138.64 | 143.35 | 149.88 | 154.59 | 161.12 | 165.83 | 172.36 |
| Fibonacci | 143.05 | 147.34 | 149.99 | 154.29 | 158.58 | 161.23 | 165.53 |
| Pivot points | S3 | S2 | S1 | PP | R1 | R2 | R3 |
|---|---|---|---|---|---|---|---|
| Standard | 108.88 | 117.04 | 132.47 | 140.63 | 156.06 | 164.21 | 179.64 |
| Camarilla | 141.41 | 143.58 | 145.74 | 147.90 | 150.06 | 152.22 | 154.39 |
| Woodie | 112.52 | 118.86 | 136.11 | 142.44 | 159.69 | 166.03 | 183.28 |
| Fibonacci | 117.04 | 126.05 | 131.62 | 140.63 | 149.64 | 155.20 | 164.21 |
Numerical data
The following are the details of the technical indicators and moving averages that were collected to generate this technical analysis:
| RSI (14): | 67.24 | |
| MACD (12,26,9): | 4.6700 | |
| Directional Movement: | 19.28 | |
| AROON (14): | 71.43 | |
| DEMA (21): | 157.15 | |
| Parabolic SAR (0,02-0,02-0,2): | 148.86 | |
| Elder Ray (13): | 4.77 | |
| Super Trend (3,10): | 146.19 | |
| Zig ZAG (10): | 156.50 | |
| VORTEX (21): | 1.1700 | |
| Stochastique (14,3,5): | 76.79 | |
| TEMA (21): | 157.63 | |
| Williams %R (14): | -27.95 | |
| Chande Momentum Oscillator (20): | 5.52 | |
| Repulse (5,40,3): | -1.6200 | |
| ROCnROLL: | 1 | |
| TRIX (15,9): | 0.4600 | |
| Courbe Coppock: | 10.29 |
| MA7: | 155.51 | |
| MA20: | 151.06 | |
| MA50: | 142.09 | |
| MA100: | 127.31 | |
| MAexp7: | 155.38 | |
| MAexp20: | 150.90 | |
| MAexp50: | 142.20 | |
| MAexp100: | 132.88 | |
| Price / MA7: | +0.64% | |
| Price / MA20: | +3.60% | |
| Price / MA50: | +10.14% | |
| Price / MA100: | +22.93% | |
| Price / MAexp7: | +0.72% | |
| Price / MAexp20: | +3.71% | |
| Price / MAexp50: | +10.06% | |
| Price / MAexp100: | +17.78% |
News
The latest news and videos published on KLA CORP. at the time of the analysis were as follows:
- SHAREHOLDER ALERT: Purcell Julie & Lefkowitz LLP Is Investigating KLA Corporation for Potential Breaches of Fiduciary Duty By Its Board of Directors
- KLA Corporation Hosts Investor Day
- KLA Joins Automotive Electronics Council
- KLA Corporation Reports Fiscal 2019 Fourth Quarter And Full Year Results
- KLA Declares Regular Cash Dividend
About author

Online


Add a comment
Comments
0 comments on the analysis KLA CORP. - Daily