LAND SECURITIES GRP. ORD 10 2/3P - Daily - Technical analysis published on 11/18/2019 (GMT)
- Who voted?
- 249
- 0
Click here for a new analysis!
- Timeframe : Daily
- - Analysis generated on
- Status : TARGET REACHED

Summary of the analysis

Additional analysis
Quotes
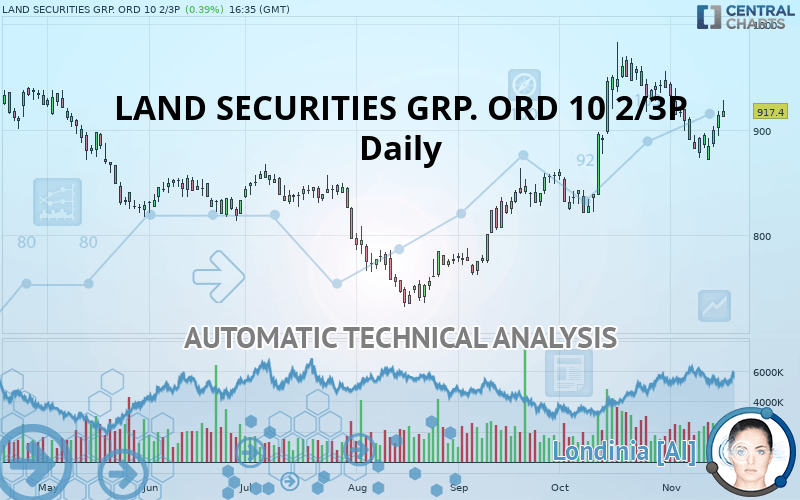
LAND SECURITIES GRP. ORD 10 2/3P rating 917.4 GBX. On the day, this instrument gained +0.39% and was traded between 911.6 GBX and 928.4 GBX over the period. The price is currently at +0.64% from its lowest and -1.18% from its highest.The Central Gaps scanner detects the formation of a bullish gap marking the strong presence of buyers against sellers at the opening. This formed a quotation gap.
Opening Gap UP
Type : Bullish
Timeframe : Openning
A study of price movements over other periods shows the following variations:
Technical
Technical analysis of LAND SECURITIES GRP. ORD 10 2/3P in Daily shows a strongly overall bullish trend. The signals given by moving averages are 89.29% bullish. This strongly bullish trend seems to be running out of steam given the signals being given by short-term moving averages. The Central Indicators market scanner is currently detecting several bearish signals that could impact this trend:
Moving Average bearish crossovers : AMA20 & AMA50
Type : Bearish
Timeframe : Daily
Bearish price crossover with Moving Average 50
Type : Bearish
Timeframe : Daily
Bearish price crossover with Moving Average 100
Type : Bearish
Timeframe : Daily
Bearish price crossover with adaptative moving average 20
Type : Bearish
Timeframe : Daily
Bearish price crossover with adaptative moving average 50
Type : Bearish
Timeframe : Daily
Bearish price crossover with adaptative moving average 100
Type : Bearish
Timeframe : Daily
An assessment of technical indicators does not currently provide any relevant information on the direction of future price movements.
Caution: the Central Indicators scanner currently detects an excess:
CCI indicator is oversold : under -100
Type : Neutral
Timeframe : Daily
Williams %R indicator is oversold : under -80
Type : Neutral
Timeframe : Daily
Williams %R indicator is overbought : over -20
Type : Neutral
Timeframe : Daily
Pivot points : price is over resistance 3
Type : Neutral
Timeframe : Daily
Pivot points : price is under support 3
Type : Neutral
Timeframe : Weekly
RSI indicator is back under 50
Type : Bearish
Timeframe : Daily
MACD indicator is back under 0
Type : Bearish
Timeframe : Daily
Price is back over the pivot point
Type : Bullish
Timeframe : Weekly
Williams %R indicator is back under -50
Type : Bearish
Timeframe : Daily
The Central Patterns scanner, which studies chart patterns, resistances and supports, has identified these signals:
Near horizontal resistance
Type : Bearish
Timeframe : Daily
Near resistance of channel
Type : Bearish
Timeframe : Daily
No result was found by the Central Candlesticks scanner on Japanese candlesticks.
| S3 | S2 | S1 | Price | R1 | R2 | R3 | |
|---|---|---|---|---|---|---|---|
| ProTrendLines | 819.7 | 858.5 | 897.3 | 917.4 | 921.0 | 963.0 | 1,070.8 |
| Change (%) | -10.65% | -6.42% | -2.19% | - | +0.39% | +4.97% | +16.72% |
| Change | -97.7 | -58.9 | -20.1 | - | +3.6 | +45.6 | +153.4 |
| Level | Intermediate | Intermediate | Intermediate | - | Major | Intermediate | Minor |
Attention could also be paid to pivot points to set price objectives:
| Pivot points | S3 | S2 | S1 | PP | R1 | R2 | R3 |
|---|---|---|---|---|---|---|---|
| Standard | 794.4 | 801.2 | 809.9 | 816.7 | 825.4 | 832.2 | 841.0 |
| Camarilla | 814.3 | 815.8 | 817.2 | 818.6 | 820.0 | 821.5 | 822.9 |
| Woodie | 795.3 | 801.7 | 810.8 | 817.2 | 826.4 | 832.7 | 841.9 |
| Fibonacci | 801.2 | 807.1 | 810.8 | 816.7 | 822.6 | 826.3 | 832.2 |
| Pivot points | S3 | S2 | S1 | PP | R1 | R2 | R3 |
|---|---|---|---|---|---|---|---|
| Standard | 997.2 | 1,005.0 | 1,016.3 | 1,024.1 | 1,035.4 | 1,043.2 | 1,054.4 |
| Camarilla | 1,022.3 | 1,024.0 | 1,025.8 | 1,027.5 | 1,029.3 | 1,031.0 | 1,032.8 |
| Woodie | 998.9 | 1,005.9 | 1,018.0 | 1,024.9 | 1,037.1 | 1,044.0 | 1,056.2 |
| Fibonacci | 1,005.0 | 1,012.3 | 1,016.8 | 1,024.1 | 1,031.4 | 1,035.9 | 1,043.2 |
| Pivot points | S3 | S2 | S1 | PP | R1 | R2 | R3 |
|---|---|---|---|---|---|---|---|
| Standard | 683.4 | 752.0 | 846.0 | 914.6 | 1,008.6 | 1,077.2 | 1,171.2 |
| Camarilla | 895.3 | 910.2 | 925.1 | 940.0 | 954.9 | 969.8 | 984.7 |
| Woodie | 696.1 | 758.4 | 858.7 | 921.0 | 1,021.3 | 1,083.6 | 1,183.9 |
| Fibonacci | 752.0 | 814.1 | 852.5 | 914.6 | 976.7 | 1,015.1 | 1,077.2 |
Numerical data
The following is the status of the technical indicators and moving averages at the time of publication of this technical analysis:
| RSI (14): | 53.40 | |
| MACD (12,26,9): | -2.0000 | |
| Directional Movement: | 6.3 | |
| AROON (14): | -85.8 | |
| DEMA (21): | 901.9 | |
| Parabolic SAR (0,02-0,02-0,2): | 808.0 | |
| Elder Ray (13): | 23.1 | |
| Super Trend (3,10): | 810.0 | |
| Zig ZAG (10): | 917.4 | |
| VORTEX (21): | 0.8000 | |
| Stochastique (14,3,5): | 44.00 | |
| TEMA (21): | 883.8 | |
| Williams %R (14): | -25.80 | |
| Chande Momentum Oscillator (20): | -14.8 | |
| Repulse (5,40,3): | 2.5000 | |
| ROCnROLL: | 1 | |
| TRIX (15,9): | 0.1000 | |
| Courbe Coppock: | 10.80 |
| MA7: | 888.9 | |
| MA20: | 912.6 | |
| MA50: | 883.3 | |
| MA100: | 836.3 | |
| MAexp7: | 890.1 | |
| MAexp20: | 899.6 | |
| MAexp50: | 881.3 | |
| MAexp100: | 858.9 | |
| Price / MA7: | +3.21% | |
| Price / MA20: | +0.53% | |
| Price / MA50: | +3.86% | |
| Price / MA100: | +9.70% | |
| Price / MAexp7: | +3.07% | |
| Price / MAexp20: | +1.98% | |
| Price / MAexp50: | +4.10% | |
| Price / MAexp100: | +6.81% |
News
Don"t forget to follow the news on LAND SECURITIES GRP. ORD 10 2/3P. At the time of publication of this analysis, the latest news was as follows:
-
 Land Securities Group
-
Land Securities Group
-
What corporate news to trade on Thursday: Land Securities, Acacia Mining and Royal Mail
About author

Online


Add a comment
Comments
0 comments on the analysis LAND SECURITIES GRP. ORD 10 2/3P - Daily