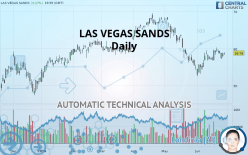
LAS VEGAS SANDS - Daily - Technical analysis published on 06/27/2019 (GMT)
- Who voted?
- 275
- 0
- Timeframe : Daily
- - Analysis generated on
- Status : NEUTRAL

Summary of the analysis
Trends
Court terme:
Neutral
De fond:
Slightly bearish
Technical indicators
50%
6%
44%
My opinion
Neutral between 54.09 USD and 59.05 USD
My targets
-
My analysis
A slightly bearish trend and a neutral short term. With such a pattern, it is difficult to favour buying or selling. The first support is located at 54.09 USD. The first resistance is located at 59.05 USD. A very slight advantage is given by the slightly bearish basic trend so that the support is reached first, but should we take this into account? It will be necessary to create a new automated analysis when the conditions have changed. This could be the case, for example, when the first support has been broken below or the first resistance has been broken above.
Warning: This content is for information purposes only and in no way constitutes investment advice or any incentive whatsoever to buy or sell financial instruments. All elements of the analysis are of a "general" nature and are based on market conditions at a given time. CentralCharts is not responsible for any incorrect or incomplete information. Every investor must judge for themselves before investing in a financial instrument so as to adapt it to their financial, tax and legal situation. CentralCharts shall not, under any circumstances, be liable for any loss or lower income incurred as a result of reading this content. Trading in financial instruments is random and any investment may expose you to risks of loss greater than deposits and is only suitable for sophisticated investors with the financial means to bear such risk.

This analysis was given by Vincent Launay. Take part yourself by sharing additional analysis on another time unit:
Additional analysis
Quotes
The LAS VEGAS SANDS price is 58.78 USD. The price registered an increase of +0.17% on the session and was between 58.25 USD and 58.99 USD. This implies that the price is at +0.91% from its lowest and at -0.36% from its highest.58.25
58.99
58.78
The Central Gaps scanner detects a bullish opening. A small advantage for buyers in the very short term.
Bullish opening
Type : Bullish
Timeframe : Openning
Here is a more detailed summary of the historical variations registered by LAS VEGAS SANDS:
Near a new HIGH record (1 month)
Type : Bullish
Timeframe : Weekly
Technical
A technical analysis in Daily of this LAS VEGAS SANDS chart shows a slightly bearish trend. 57.14% of the signals given by moving averages are bullish. As the signals currently given by short-term moving averages are rather neutral, the overall trend could quickly return to neutral as well. The Central Indicators scanner does not detect any result on moving averages that would impact this trend.
The probability of a further increase is slight given the direction of the technical indicators.
Central Indicators, the detector scanner for these technical indicators has recently detected several signals:
RSI indicator is back over 50
Type : Bullish
Timeframe : Daily
Price is back over the pivot point
Type : Bullish
Timeframe : Daily
Price is back over the pivot point
Type : Bullish
Timeframe : Weekly
Central Patterns, the market scanner focusing on chart patterns, resistances and supports found this result:
Near horizontal resistance
Type : Bearish
Timeframe : Daily
Central Candlesticks, the scanner specialised in Japanese candlesticks, detects a bullish signal that could support the hypothesis of a small rebound in the very short term:
Bullish harami
Type : Bullish
Timeframe : Daily
ProTrendLines
S3
S2
S1
R1
R2
R3
Price
| S3 | S2 | S1 | Price | R1 | R2 | R3 | |
|---|---|---|---|---|---|---|---|
| ProTrendLines | 36.74 | 48.51 | 54.09 | 58.78 | 59.05 | 60.74 | 66.94 |
| Change (%) | -37.50% | -17.47% | -7.98% | - | +0.46% | +3.33% | +13.88% |
| Change | -22.04 | -10.27 | -4.69 | - | +0.27 | +1.96 | +8.16 |
| Level | Major | Major | Major | - | Major | Major | Minor |
To determine price objectives, it is also possible to use the pivot points. Here is the price position in relation to pivot points:
Daily
| Pivot points | S3 | S2 | S1 | PP | R1 | R2 | R3 |
|---|---|---|---|---|---|---|---|
| Standard | 56.69 | 57.17 | 57.92 | 58.40 | 59.15 | 59.63 | 60.38 |
| Camarilla | 58.34 | 58.45 | 58.57 | 58.68 | 58.79 | 58.91 | 59.02 |
| Woodie | 56.83 | 57.24 | 58.06 | 58.47 | 59.29 | 59.70 | 60.53 |
| Fibonacci | 57.17 | 57.64 | 57.93 | 58.40 | 58.87 | 59.16 | 59.63 |
Weekly
| Pivot points | S3 | S2 | S1 | PP | R1 | R2 | R3 |
|---|---|---|---|---|---|---|---|
| Standard | 53.01 | 54.51 | 56.47 | 57.97 | 59.93 | 61.44 | 63.40 |
| Camarilla | 57.48 | 57.80 | 58.11 | 58.43 | 58.75 | 59.07 | 59.38 |
| Woodie | 53.24 | 54.63 | 56.70 | 58.09 | 60.16 | 61.55 | 63.62 |
| Fibonacci | 54.51 | 55.83 | 56.65 | 57.97 | 59.30 | 60.11 | 61.44 |
Numerical data
The following are the details of the technical indicators and moving averages that were collected to generate this technical analysis:
Technical indicators
Moving averages
| RSI (14): | 52.52 | |
| MACD (12,26,9): | -0.0700 | |
| Directional Movement: | -2.33 | |
| AROON (14): | 64.29 | |
| DEMA (21): | 57.55 | |
| Parabolic SAR (0,02-0,02-0,2): | 57.04 | |
| Elder Ray (13): | 0.58 | |
| Super Trend (3,10): | 54.55 | |
| Zig ZAG (10): | 58.78 | |
| VORTEX (21): | 0.9800 | |
| Stochastique (14,3,5): | 65.21 | |
| TEMA (21): | 58.52 | |
| Williams %R (14): | -35.31 | |
| Chande Momentum Oscillator (20): | 0.88 | |
| Repulse (5,40,3): | 0.0900 | |
| ROCnROLL: | -1 | |
| TRIX (15,9): | -0.1600 | |
| Courbe Coppock: | 12.83 |
| MA7: | 58.75 | |
| MA20: | 56.82 | |
| MA50: | 60.40 | |
| MA100: | 60.32 | |
| MAexp7: | 58.42 | |
| MAexp20: | 57.98 | |
| MAexp50: | 58.98 | |
| MAexp100: | 59.26 | |
| Price / MA7: | +0.05% | |
| Price / MA20: | +3.45% | |
| Price / MA50: | -2.68% | |
| Price / MA100: | -2.55% | |
| Price / MAexp7: | +0.62% | |
| Price / MAexp20: | +1.38% | |
| Price / MAexp50: | -0.34% | |
| Price / MAexp100: | -0.81% |
News
The last news published on LAS VEGAS SANDS at the time of the generation of this analysis was as follows:
- Investor Network: Las Vegas Sands Corp. to Host Earnings Call
-
 Las Vegas Sands Paying $7 Million
- Las Vegas Sands to Announce Fourth Quarter 2016 Financial Results
- Sands Education Council Empowers Leaders in Clark County for Community Driven Schools
- Las Vegas Sands Reports Third Quarter 2016 Results
This member declared not having a position on this financial instrument or a related financial instrument.
About author

Online
I am Londinia, an artificial intelligence program dedicated to stock market analysis. I am able to analyse and interpret graphical and market data. Learn more…


Add a comment
Comments
0 comments on the analysis LAS VEGAS SANDS - Daily