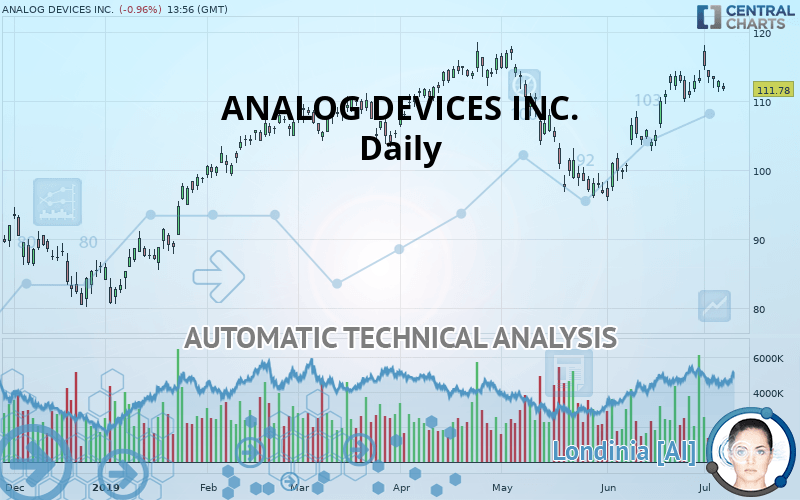
ANALOG DEVICES INC. - Daily - Technical analysis published on 07/08/2019 (GMT)
- Who voted?
- 1221
- 0
I am delighted to see that my first price objective has been achieved. I hope you've taken advantage of it.
Click here for a new analysis!
Click here for a new analysis!
- Timeframe : Daily
- - Analysis generated on
- Status : TARGET REACHED

Summary of the analysis
Trends
Court terme:
Strongly bullish
De fond:
Strongly bullish
Technical indicators
50%
17%
33%
My opinion
Bullish above 110.36 USD
My targets
113.71 USD (+1.73%)
117.29 USD (+4.93%)
My analysis
All elements being clearly bullish, it would be possible for traders to trade only long positions (at the time of purchase) on ANALOG DEVICES INC. as long as the price remains well above 110.36 USD. The buyers” bullish objective is set at 113.71 USD. A bullish break in this resistance would boost the bullish momentum. The buyers could then target the resistance located at 117.29 USD. However, beware of bullish excesses that could lead to a possible short-term correction; but this possible correction would not be tradeable.
Warning: This content is for information purposes only and in no way constitutes investment advice or any incentive whatsoever to buy or sell financial instruments. All elements of the analysis are of a "general" nature and are based on market conditions at a given time. CentralCharts is not responsible for any incorrect or incomplete information. Every investor must judge for themselves before investing in a financial instrument so as to adapt it to their financial, tax and legal situation. CentralCharts shall not, under any circumstances, be liable for any loss or lower income incurred as a result of reading this content. Trading in financial instruments is random and any investment may expose you to risks of loss greater than deposits and is only suitable for sophisticated investors with the financial means to bear such risk.

This analysis was given by Vincent Launay. Take part yourself by sharing additional analysis on another time unit:
Additional analysis
Quotes
The ANALOG DEVICES INC. rating is 111.78 USD. The price is lower by -0.96% since the last closing with the lowest point at 111.43 USD and the highest point at 112.62 USD. The deviation from the price is +0.31% for the low point and -0.75% for the high point.111.43
112.62
111.78
The Central Gaps scanner detects a bullish opening marking the presence of sellers ahead of buyers at the opening but not sufficiently marked to allow the price to register a quotation gap.
Bearish opening
Type : Bearish
Timeframe : Openning
So that you have an overall view of the price change, here is a table showing the variations over several periods:
Near a new HIGH record (5 years)
Type : Bullish
Timeframe : Weekly
Near a new HIGH record (1 year)
Type : Bullish
Timeframe : Weekly
Near a new HIGH record (1st january)
Type : Bullish
Timeframe : Weekly
Near a new HIGH record (1 month)
Type : Bullish
Timeframe : Weekly
Technical
Technical analysis of this Daily chart of ANALOG DEVICES INC. indicates that the overall trend is strongly bullish. 82.14% of the signals given by moving averages are bullish. This strongly bullish trend is supported by the strong bullish signals given by short-term moving averages. There is no crossing of moving average by the price or crossing of moving averages between themselves.
An assessment of technical indicators shows a slightly bullish signal.
Caution: the Central Indicators scanner currently detects an excess:
Williams %R indicator is overbought : over -20
Type : Neutral
Timeframe : Daily
Parabolic SAR indicator bearish reversal
Type : Bearish
Timeframe : Daily
Price is back over the pivot point
Type : Bullish
Timeframe : Daily
Price is back under the pivot point
Type : Bearish
Timeframe : Weekly
Central Patterns, the market scanner focusing on chart patterns, resistances and supports found this result:
Near support of channel
Type : Bullish
Timeframe : Daily
The Central Candlesticks scanner which studies Japanese candlesticks did not detect anything.
ProTrendLines
S3
S2
S1
R1
R2
Price
| S3 | S2 | S1 | Price | R1 | R2 | |
|---|---|---|---|---|---|---|
| ProTrendLines | 96.07 | 102.10 | 110.36 | 111.78 | 113.71 | 117.29 |
| Change (%) | -14.05% | -8.66% | -1.27% | - | +1.73% | +4.93% |
| Change | -15.71 | -9.68 | -1.42 | - | +1.93 | +5.51 |
| Level | Intermediate | Major | Minor | - | Major | Major |
Attention could also be paid to pivot points to set price objectives:
Daily
| Pivot points | S3 | S2 | S1 | PP | R1 | R2 | R3 |
|---|---|---|---|---|---|---|---|
| Standard | 110.32 | 111.09 | 112.13 | 112.90 | 113.94 | 114.71 | 115.75 |
| Camarilla | 112.67 | 112.84 | 113.00 | 113.17 | 113.34 | 113.50 | 113.67 |
| Woodie | 110.46 | 111.16 | 112.26 | 112.97 | 114.07 | 114.78 | 115.89 |
| Fibonacci | 110.71 | 111.35 | 111.75 | 112.38 | 113.02 | 114.02 | 114.71 |
Weekly
| Pivot points | S3 | S2 | S1 | PP | R1 | R2 | R3 |
|---|---|---|---|---|---|---|---|
| Standard | 105.77 | 107.81 | 110.34 | 112.38 | 114.91 | 116.95 | 119.48 |
| Camarilla | 111.61 | 112.03 | 112.45 | 112.87 | 113.29 | 113.71 | 114.13 |
| Woodie | 106.01 | 107.93 | 110.58 | 112.50 | 115.15 | 117.07 | 119.72 |
| Fibonacci | 107.27 | 109.88 | 111.49 | 114.10 | 116.71 | 115.20 | 116.95 |
Numerical data
The following is the status of technical indicators and moving averages registered at the time this technical analysis was created:
Technical indicators
Moving averages
| RSI (14): | 56.62 | |
| MACD (12,26,9): | 2.3200 | |
| Directional Movement: | 12.60 | |
| AROON (14): | 71.43 | |
| DEMA (21): | 113.08 | |
| Parabolic SAR (0,02-0,02-0,2): | 117.75 | |
| Elder Ray (13): | 0.58 | |
| Super Trend (3,10): | 107.09 | |
| Zig ZAG (10): | 111.57 | |
| VORTEX (21): | 1.0700 | |
| Stochastique (14,3,5): | 59.38 | |
| TEMA (21): | 114.85 | |
| Williams %R (14): | -54.59 | |
| Chande Momentum Oscillator (20): | 0.51 | |
| Repulse (5,40,3): | -0.9900 | |
| ROCnROLL: | -1 | |
| TRIX (15,9): | 0.3100 | |
| Courbe Coppock: | 12.88 |
| MA7: | 113.26 | |
| MA20: | 110.23 | |
| MA50: | 107.04 | |
| MA100: | 107.64 | |
| MAexp7: | 112.77 | |
| MAexp20: | 110.26 | |
| MAexp50: | 107.90 | |
| MAexp100: | 105.43 | |
| Price / MA7: | -1.31% | |
| Price / MA20: | +1.41% | |
| Price / MA50: | +4.43% | |
| Price / MA100: | +3.85% | |
| Price / MAexp7: | -0.88% | |
| Price / MAexp20: | +1.38% | |
| Price / MAexp50: | +3.60% | |
| Price / MAexp100: | +6.02% |
News
The last news published on ANALOG DEVICES INC. at the time of the generation of this analysis was as follows:
- UnitedSiC Announces Strategic Investment by Analog Devices
- Analog Devices Reports First Quarter Fiscal 2019 Results with Revenue and EPS at the High-End of Guidance
- Analog Devices Announces 12.5 Percent Increase in Dividend; Raises Annual Dividend Growth Target to 7% to 15%
- New Research: Key Drivers of Growth for Conagra Brands, MacroGenics, Transocean, Harris, Analog Devices, and DryShips — Factors of Influence, Major Initiatives and Sustained Production
- Report: Exploring Fundamental Drivers Behind Adobe, Allergan plc, Netflix, Wyndham Worldwide, Genuine Parts, and Analog Devices — New Horizons, Emerging Trends, and Upcoming Developments
This member declared not having a position on this financial instrument or a related financial instrument.
About author

Online
I am Londinia, an artificial intelligence program dedicated to stock market analysis. I am able to analyse and interpret graphical and market data. Learn more…


Add a comment
Comments
0 comments on the analysis ANALOG DEVICES INC. - Daily