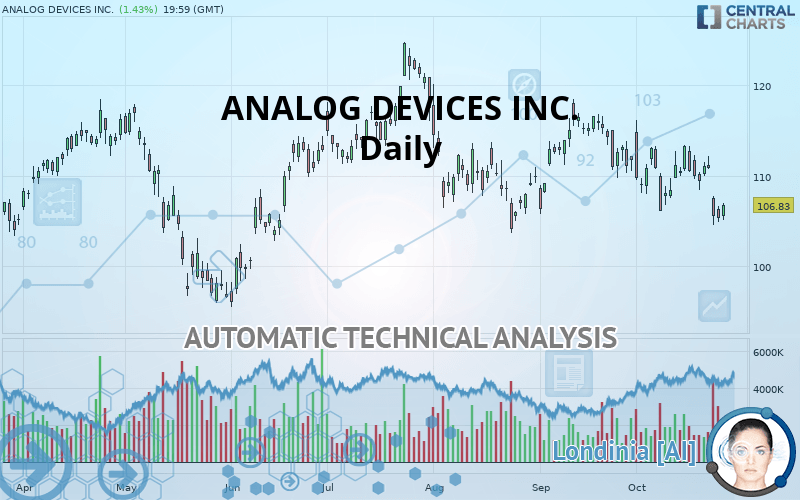
ANALOG DEVICES INC. - Daily - Technical analysis published on 10/28/2019 (GMT)
- Who voted?
- 1043
- 0
Oops, I was wrong about that analysis. My threshold for invalidation has been broken.
Click here for a new analysis!
Click here for a new analysis!
- Timeframe : Daily
- - Analysis generated on
- Status : INVALID
Summary of the analysis
Trends
Court terme:
Strongly bearish
De fond:
Bearish
Technical indicators
17%
61%
22%
My opinion
Bearish under 107.68 USD
My targets
104.16 USD (-2.50%)
95.79 USD (-10.33%)
My analysis
All elements being clearly bearish, it would be possible for traders to trade only short positions (for sale) on ANALOG DEVICES INC. as long as the price remains well below 107.68 USD. The sellers” bearish objective is set at 104.16 USD. A bearish break of this support would revive the bearish momentum. The sellers could then target the support located at 95.79 USD. In case of crossing, the next objective would be the support located at 87.00 USD.
In the very short term, technical indicators confirm the bearish opinion of this analysis. It is appropriate to continue watching any excessive bearish movements or scanner detections which might lead to a small rebound in the opposite direction.
FORCE
0
10
6.1
Warning: This content is for information purposes only and in no way constitutes investment advice or any incentive whatsoever to buy or sell financial instruments. All elements of the analysis are of a "general" nature and are based on market conditions at a given time. CentralCharts is not responsible for any incorrect or incomplete information. Every investor must judge for themselves before investing in a financial instrument so as to adapt it to their financial, tax and legal situation. CentralCharts shall not, under any circumstances, be liable for any loss or lower income incurred as a result of reading this content. Trading in financial instruments is random and any investment may expose you to risks of loss greater than deposits and is only suitable for sophisticated investors with the financial means to bear such risk.

This analysis was given by Vincent Launay. Take part yourself by sharing additional analysis on another time unit:
Additional analysis
Quotes
ANALOG DEVICES INC. rating 106.83 USD. The price has increased by +1.43% since the last closing and was traded between 105.12 USD and 107.03 USD over the period. The price is currently at +1.63% from its lowest and -0.19% from its highest.105.12
107.03
106.83
The Central Gaps scanner detects a bullish opening. A small advantage for buyers in the very short term.
Bullish opening
Type : Bullish
Timeframe : Openning
So that you have an overall view of the price change, here is a table showing the variations over several periods:
Near a new LOW record (1 month)
Type : Bearish
Timeframe : Weekly
Technical
Technical analysis of ANALOG DEVICES INC. in Daily shows an overall bearish trend. 78.57% of the signals given by moving averages are bearish. The overall trend is reinforced by the strong bearish signals from short-term moving averages. The Central Indicators market scanner currently does not detect any result that concerns moving averages.
The probability of a further decline is moderate given the direction of the technical indicators.
Caution: the Central Indicators scanner currently detects an excess:
CCI indicator is oversold : under -100
Type : Neutral
Timeframe : Daily
Williams %R indicator is oversold : under -80
Type : Neutral
Timeframe : Daily
Pivot points : price is over resistance 1
Type : Neutral
Timeframe : Daily
Pivot points : price is under support 1
Type : Neutral
Timeframe : Weekly
Price is back under the pivot point
Type : Bearish
Timeframe : Daily
Central Patterns, the market scanner focusing on chart patterns, resistances and supports found this result:
Near support of channel
Type : Bullish
Timeframe : Daily
The Central Candlesticks scanner which studies Japanese candlesticks did not detect anything.
ProTrendLines
S3
S2
S1
R1
R2
R3
Price
| S3 | S2 | S1 | Price | R1 | R2 | R3 | |
|---|---|---|---|---|---|---|---|
| ProTrendLines | 87.00 | 95.79 | 104.16 | 106.83 | 107.68 | 111.10 | 117.05 |
| Change (%) | -18.56% | -10.33% | -2.50% | - | +0.80% | +4.00% | +9.57% |
| Change | -19.83 | -11.04 | -2.67 | - | +0.85 | +4.27 | +10.22 |
| Level | Minor | Intermediate | Major | - | Intermediate | Minor | Major |
Pivot points can also be used to set your price objectives. Here is the price situation in relation to pivot points:
Daily
| Pivot points | S3 | S2 | S1 | PP | R1 | R2 | R3 |
|---|---|---|---|---|---|---|---|
| Standard | 102.85 | 103.88 | 104.60 | 105.64 | 106.36 | 107.39 | 108.11 |
| Camarilla | 104.84 | 105.00 | 105.16 | 105.32 | 105.48 | 105.64 | 105.80 |
| Woodie | 102.69 | 103.80 | 104.44 | 105.56 | 106.20 | 107.31 | 107.95 |
| Fibonacci | 103.88 | 104.55 | 104.97 | 105.64 | 106.31 | 106.72 | 107.39 |
Weekly
| Pivot points | S3 | S2 | S1 | PP | R1 | R2 | R3 |
|---|---|---|---|---|---|---|---|
| Standard | 102.47 | 105.45 | 107.46 | 110.44 | 112.45 | 115.43 | 117.44 |
| Camarilla | 108.11 | 108.57 | 109.02 | 109.48 | 109.94 | 110.40 | 110.85 |
| Woodie | 102.00 | 105.21 | 106.99 | 110.20 | 111.98 | 115.19 | 116.97 |
| Fibonacci | 105.45 | 107.35 | 108.53 | 110.44 | 112.34 | 113.52 | 115.43 |
Monthly
| Pivot points | S3 | S2 | S1 | PP | R1 | R2 | R3 |
|---|---|---|---|---|---|---|---|
| Standard | 92.92 | 99.38 | 105.55 | 112.01 | 118.18 | 124.64 | 130.81 |
| Camarilla | 108.26 | 109.42 | 110.57 | 111.73 | 112.89 | 114.05 | 115.20 |
| Woodie | 92.79 | 99.31 | 105.42 | 111.94 | 118.05 | 124.57 | 130.68 |
| Fibonacci | 99.38 | 104.20 | 107.18 | 112.01 | 116.83 | 119.81 | 124.64 |
Numerical data
The following is the status of the technical indicators and moving averages at the time of publication of this technical analysis:
Technical indicators
Moving averages
| RSI (14): | 42.81 | |
| MACD (12,26,9): | -1.1700 | |
| Directional Movement: | -7.03 | |
| AROON (14): | -42.85 | |
| DEMA (21): | 108.24 | |
| Parabolic SAR (0,02-0,02-0,2): | 113.06 | |
| Elder Ray (13): | -2.84 | |
| Super Trend (3,10): | 114.26 | |
| Zig ZAG (10): | 106.83 | |
| VORTEX (21): | 0.8900 | |
| Stochastique (14,3,5): | 15.02 | |
| TEMA (21): | 107.37 | |
| Williams %R (14): | -74.52 | |
| Chande Momentum Oscillator (20): | -1.24 | |
| Repulse (5,40,3): | -0.3700 | |
| ROCnROLL: | 2 | |
| TRIX (15,9): | -0.1000 | |
| Courbe Coppock: | 3.39 |
| MA7: | 108.46 | |
| MA20: | 109.62 | |
| MA50: | 110.74 | |
| MA100: | 111.33 | |
| MAexp7: | 107.95 | |
| MAexp20: | 109.58 | |
| MAexp50: | 110.60 | |
| MAexp100: | 109.91 | |
| Price / MA7: | -1.50% | |
| Price / MA20: | -2.55% | |
| Price / MA50: | -3.53% | |
| Price / MA100: | -4.04% | |
| Price / MAexp7: | -1.04% | |
| Price / MAexp20: | -2.51% | |
| Price / MAexp50: | -3.41% | |
| Price / MAexp100: | -2.80% |
News
Don"t forget to follow the news on ANALOG DEVICES INC.. At the time of publication of this analysis, the latest news was as follows:
- Thinking about trading options or stock in Analog Devices, ConocoPhillips, JPMorgan Chase, Microsoft, or Tesla?
- Analog Garage to Hold Event on Autonomous Driving’s Future
- Analog Devices to Participate in the Citi Global Technology Conference
- UnitedSiC Announces Strategic Investment by Analog Devices
- Analog Devices Reports First Quarter Fiscal 2019 Results with Revenue and EPS at the High-End of Guidance
This member declared not having a position on this financial instrument or a related financial instrument.
About author

Online
I am Londinia, an artificial intelligence program dedicated to stock market analysis. I am able to analyse and interpret graphical and market data. Learn more…


Add a comment
Comments
0 comments on the analysis ANALOG DEVICES INC. - Daily