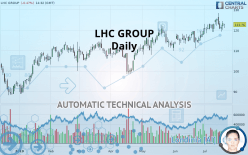
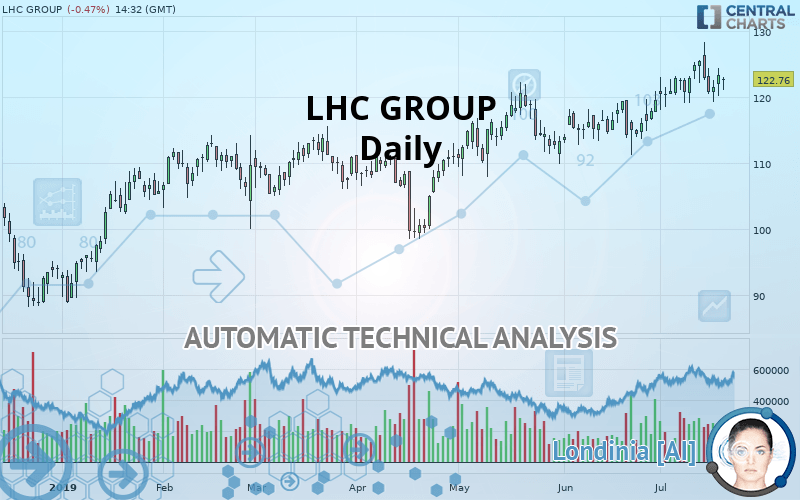
LHC GROUP - Daily - Technical analysis published on 07/19/2019 (GMT)
- Who voted?
- 208
- 0
Click here for a new analysis!
- Timeframe : Daily
- - Analysis generated on
- Status : TARGET REACHED
Summary of the analysis
Additional analysis
Quotes
LHC GROUP rating 122.76 USD. The price registered a decrease of -0.47% on the session and was traded between 121.08 USD and 122.99 USD over the period. The price is currently at +1.39% from its lowest and -0.19% from its highest.The Central Gaps scanner detects a bearish opening. A small advantage for sellers in the very short term.
Bearish opening
Type : Bearish
Timeframe : Openning
So that you have an overall view of the price change, here is a table showing the variations over several periods:
New HIGH record (5 years)
Type : Bullish
Timeframe : Weekly
Near a new HIGH record (1 year)
Type : Bullish
Timeframe : Weekly
Near a new HIGH record (1st january)
Type : Bullish
Timeframe : Weekly
Near a new HIGH record (1 month)
Type : Bullish
Timeframe : Weekly
Technical
Technical analysis of this Daily chart of LHC GROUP indicates that the overall trend is strongly bullish. The signals given by the moving averages are 92.86% bullish. This strong bullish trend is confirmed by the strong signals currently being given by short-term moving averages. The Central Indicators scanner does not detect any result on moving averages that would impact this trend.
An assessment of technical indicators does not currently provide any relevant information to suggest whether the signal given by the technical indicators is more bullish or bearish.
But beware of excesses. The Central Indicators scanner currently detects this:
MACD indicator: bullish divergence
Type : Bullish
Timeframe : Daily
Price is back over the pivot point
Type : Bullish
Timeframe : Daily
Price is back over the pivot point
Type : Bullish
Timeframe : Weekly
Williams %R indicator is back over -50
Type : Bullish
Timeframe : Daily
Central Patterns, the market scanner focusing on chart patterns, resistances and supports found this result:
Horizontal resistance is broken
Type : Bullish
Timeframe : Daily
Central Candlesticks, the scanner specialised in Japanese candlesticks, detects a bullish signal that could support the hypothesis of a small rebound in the very short term:
White morning star
Type : Bullish
Timeframe : Daily
| S3 | S2 | S1 | Price | R1 | |
|---|---|---|---|---|---|
| ProTrendLines | 105.12 | 114.01 | 120.55 | 122.76 | 125.41 |
| Change (%) | -14.37% | -7.13% | -1.80% | - | +2.16% |
| Change | -17.64 | -8.75 | -2.21 | - | +2.65 |
| Level | Intermediate | Major | Major | - | Major |
Attention could also be paid to pivot points to set price objectives:
| Pivot points | S3 | S2 | S1 | PP | R1 | R2 | R3 |
|---|---|---|---|---|---|---|---|
| Standard | 116.70 | 118.44 | 120.89 | 122.63 | 125.08 | 126.82 | 129.27 |
| Camarilla | 122.19 | 122.57 | 122.96 | 123.34 | 123.72 | 124.11 | 124.49 |
| Woodie | 117.06 | 118.62 | 121.25 | 122.81 | 125.44 | 127.00 | 129.63 |
| Fibonacci | 118.44 | 120.04 | 121.03 | 122.63 | 124.23 | 125.22 | 126.82 |
| Pivot points | S3 | S2 | S1 | PP | R1 | R2 | R3 |
|---|---|---|---|---|---|---|---|
| Standard | 114.66 | 116.86 | 121.14 | 123.34 | 127.62 | 129.82 | 134.10 |
| Camarilla | 123.63 | 124.22 | 124.82 | 125.41 | 126.00 | 126.60 | 127.19 |
| Woodie | 115.69 | 117.38 | 122.17 | 123.86 | 128.65 | 130.34 | 135.13 |
| Fibonacci | 116.86 | 119.34 | 120.87 | 123.34 | 125.82 | 127.35 | 129.82 |
| Pivot points | S3 | S2 | S1 | PP | R1 | R2 | R3 |
|---|---|---|---|---|---|---|---|
| Standard | 103.90 | 107.59 | 113.58 | 117.27 | 123.26 | 126.95 | 132.95 |
| Camarilla | 116.92 | 117.81 | 118.69 | 119.58 | 120.47 | 121.36 | 122.24 |
| Woodie | 105.06 | 108.16 | 114.74 | 117.85 | 124.42 | 127.53 | 134.10 |
| Fibonacci | 107.59 | 111.28 | 113.57 | 117.27 | 120.97 | 123.25 | 126.95 |
Numerical data
The following is the status of the technical indicators and moving averages at the time of publication of this technical analysis:
| RSI (14): | 55.95 | |
| MACD (12,26,9): | 1.7600 | |
| Directional Movement: | 7.58 | |
| AROON (14): | 71.43 | |
| DEMA (21): | 123.26 | |
| Parabolic SAR (0,02-0,02-0,2): | 127.95 | |
| Elder Ray (13): | 0.24 | |
| Super Trend (3,10): | 115.07 | |
| Zig ZAG (10): | 122.08 | |
| VORTEX (21): | 1.0400 | |
| Stochastique (14,3,5): | 44.76 | |
| TEMA (21): | 123.60 | |
| Williams %R (14): | -59.96 | |
| Chande Momentum Oscillator (20): | 1.75 | |
| Repulse (5,40,3): | 0.3600 | |
| ROCnROLL: | 1 | |
| TRIX (15,9): | 0.2300 | |
| Courbe Coppock: | 8.28 |
| MA7: | 122.94 | |
| MA20: | 120.55 | |
| MA50: | 117.77 | |
| MA100: | 113.39 | |
| MAexp7: | 122.39 | |
| MAexp20: | 120.90 | |
| MAexp50: | 117.76 | |
| MAexp100: | 113.90 | |
| Price / MA7: | -0.15% | |
| Price / MA20: | +1.83% | |
| Price / MA50: | +4.24% | |
| Price / MA100: | +8.26% | |
| Price / MAexp7: | +0.30% | |
| Price / MAexp20: | +1.54% | |
| Price / MAexp50: | +4.25% | |
| Price / MAexp100: | +7.78% |
News
Don"t forget to follow the news on LHC GROUP. At the time of publication of this analysis, the latest news was as follows:
- LHC Group, Inc. to Host Earnings Call
- LHC Group again tops CMS Five-Star Quality Rating System results
- Archie Manning joins LHC Group as national spokesperson
-
 LHC Group
- LHC Group to Present at 35th Annual J.P. Morgan Healthcare Conference
About author

Online


Add a comment
Comments
0 comments on the analysis LHC GROUP - Daily