LINCOLN ELECTRIC HLD. - Daily - Technical analysis published on 07/16/2019 (GMT)
- Who voted?
- 170
- 0
Click here for a new analysis!
- Timeframe : Daily
- - Analysis generated on
- Status : TARGET REACHED

Summary of the analysis

Additional analysis
Quotes
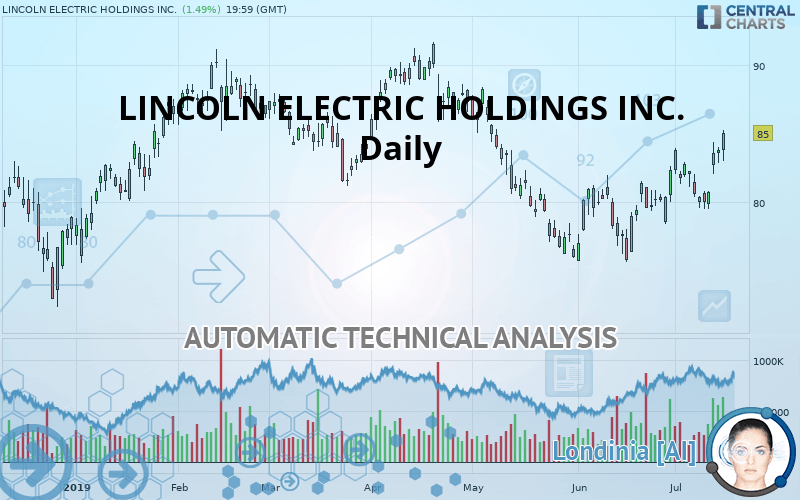
The LINCOLN ELECTRIC HOLDINGS INC. price is 85.00 USD. On the day, this instrument gained +1.49% and was traded between 83.00 USD and 85.25 USD over the period. The price is currently at +2.41% from its lowest and -0.29% from its highest.A study of price movements over other periods shows the following variations:
Technical
Technical analysis of LINCOLN ELECTRIC HOLDINGS INC. in Daily shows an overall slightly bullish trend. Only 57.14% of the signals given by moving averages are bullish. This slightly bullish trend is reinforced by the strong signals currently being given by short-term moving averages. An assessment of moving averages reveals several bullish signals that could impact this trend:
Moving Average bullish crossovers : MA20 & MA50
Type : Bullish
Timeframe : Daily
Bullish price crossover with Moving Average 100
Type : Bullish
Timeframe : Daily
Technical indicators are strongly bullish, suggesting that the price increase should continue.
But beware of excesses. The Central Indicators scanner currently detects this:
CCI indicator is overbought : over 100
Type : Neutral
Timeframe : Daily
CCI indicator: bearish divergence
Type : Bearish
Timeframe : Daily
Williams %R indicator is overbought : over -20
Type : Neutral
Timeframe : Daily
Pivot points : price is over resistance 2
Type : Neutral
Timeframe : Daily
Ichimoku : price is over the cloud
Type : Bullish
Timeframe : Daily
Price is back over the pivot point
Type : Bullish
Timeframe : Weekly
An analysis of the price chart with the Central Patterns scanner (detector of chart patterns and resistances and supports) shows several results that can have an impact on the price change:
Near horizontal resistance
Type : Bearish
Timeframe : Daily
Resistance of channel is broken
Type : Bullish
Timeframe : Daily
The Central Candlesticks scanner, specialised in Japanese candlesticks, did not identify any signals.
| S3 | S2 | S1 | Price | R1 | R2 | R3 | |
|---|---|---|---|---|---|---|---|
| ProTrendLines | 75.36 | 79.58 | 81.59 | 85.00 | 85.03 | 87.27 | 91.51 |
| Change (%) | -11.34% | -6.38% | -4.01% | - | +0.04% | +2.67% | +7.66% |
| Change | -9.64 | -5.42 | -3.41 | - | +0.03 | +2.27 | +6.51 |
| Level | Major | Intermediate | Major | - | Major | Intermediate | Intermediate |
Attention could also be paid to pivot points to set price objectives:
| Pivot points | S3 | S2 | S1 | PP | R1 | R2 | R3 |
|---|---|---|---|---|---|---|---|
| Standard | 81.85 | 82.34 | 83.04 | 83.53 | 84.23 | 84.72 | 85.42 |
| Camarilla | 83.42 | 83.53 | 83.64 | 83.75 | 83.86 | 83.97 | 84.08 |
| Woodie | 81.97 | 82.39 | 83.16 | 83.58 | 84.35 | 84.77 | 85.54 |
| Fibonacci | 82.34 | 82.79 | 83.07 | 83.53 | 83.98 | 84.26 | 84.72 |
| Pivot points | S3 | S2 | S1 | PP | R1 | R2 | R3 |
|---|---|---|---|---|---|---|---|
| Standard | 75.65 | 77.56 | 80.55 | 82.46 | 85.45 | 87.36 | 90.35 |
| Camarilla | 82.19 | 82.64 | 83.09 | 83.54 | 83.99 | 84.44 | 84.89 |
| Woodie | 76.19 | 77.83 | 81.09 | 82.73 | 85.99 | 87.63 | 90.89 |
| Fibonacci | 77.56 | 79.43 | 80.59 | 82.46 | 84.33 | 85.49 | 87.36 |
| Pivot points | S3 | S2 | S1 | PP | R1 | R2 | R3 |
|---|---|---|---|---|---|---|---|
| Standard | 70.74 | 73.15 | 77.74 | 80.15 | 84.74 | 87.15 | 91.74 |
| Camarilla | 80.40 | 81.04 | 81.68 | 82.32 | 82.96 | 83.60 | 84.25 |
| Woodie | 71.82 | 73.70 | 78.82 | 80.70 | 85.82 | 87.70 | 92.82 |
| Fibonacci | 73.15 | 75.83 | 77.48 | 80.15 | 82.83 | 84.48 | 87.15 |
Numerical data
The following is the status of technical indicators and moving averages registered at the time this technical analysis was created:
| RSI (14): | 64.77 | |
| MACD (12,26,9): | 0.8100 | |
| Directional Movement: | 16.13 | |
| AROON (14): | 85.71 | |
| DEMA (21): | 82.31 | |
| Parabolic SAR (0,02-0,02-0,2): | 79.86 | |
| Elder Ray (13): | 2.14 | |
| Super Trend (3,10): | 78.78 | |
| Zig ZAG (10): | 85.00 | |
| VORTEX (21): | 1.0800 | |
| Stochastique (14,3,5): | 90.76 | |
| TEMA (21): | 83.46 | |
| Williams %R (14): | -3.62 | |
| Chande Momentum Oscillator (20): | 4.67 | |
| Repulse (5,40,3): | 3.7500 | |
| ROCnROLL: | 1 | |
| TRIX (15,9): | 0.0800 | |
| Courbe Coppock: | 6.47 |
| MA7: | 81.97 | |
| MA20: | 81.22 | |
| MA50: | 80.42 | |
| MA100: | 83.57 | |
| MAexp7: | 82.79 | |
| MAexp20: | 81.48 | |
| MAexp50: | 81.52 | |
| MAexp100: | 82.61 | |
| Price / MA7: | +3.70% | |
| Price / MA20: | +4.65% | |
| Price / MA50: | +5.70% | |
| Price / MA100: | +1.71% | |
| Price / MAexp7: | +2.67% | |
| Price / MAexp20: | +4.32% | |
| Price / MAexp50: | +4.27% | |
| Price / MAexp100: | +2.89% |
News
The latest news and videos published on LINCOLN ELECTRIC HOLDINGS INC. at the time of the analysis were as follows:
- Lincoln Electric Holdings, Inc. to Host Earnings Call
- Lincoln Electric Holdings, Inc. to Host Earnings Call
- Investor Network: Lincoln Electric Holdings, Inc. to Host Earnings Call
- Universal Technical Institute (UTI) Launches New Welding Technology Program
- Investor Network: Lands' End, Inc. to Host Earnings Call
About author

Online


Add a comment
Comments
0 comments on the analysis LINCOLN ELECTRIC HLD. - Daily