LLOYDS BANKING GRP. ORD 10P - Lloyds Bank ((LSE: LLOY.L) Continues the Downward Tendency - 08/21/2017 (GMT)
- Who voted?
- 1453
- 0
- Timeframe : Daily
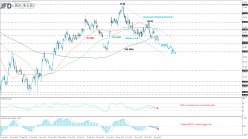

LLOYDS BANKING GRP. ORD 10P Chart
Are you looking for opportunities in European stocks?
DISCOVER LONDINIA OPPORTUNITIES...
DISCOVER LONDINIA OPPORTUNITIES...
The Lloyds Bank (LSE: LLOY.L) plc is a British retail and commercial bank with branches across England and Wales. The share price is completing the third consecutive bearish month and is still slipping lower, plunging almost 12% since June. Moreover, the price is developing within a downward sloping channel following the bounce off the £73.55 resistance level.
From the technical point of view, the price is developing below the three simple moving averages (50, 100 and 200) on the daily chart, whilst the 50-SMA created a bearish crossover with the 100-SMA indicating further losses. Over the previous days, the 200-SMA acted as strong resistance obstacle for the bears and pushed the price lower. In the case of a penetration below the £63.80 barrier will open the door for the £61.75 support level. Additionally, the technical indicators are moving lower. The RSI indicator is pointing to the downside into the bearish territory, while the MACD oscillator is dropping below the trigger and zero lines.
From the technical point of view, the price is developing below the three simple moving averages (50, 100 and 200) on the daily chart, whilst the 50-SMA created a bearish crossover with the 100-SMA indicating further losses. Over the previous days, the 200-SMA acted as strong resistance obstacle for the bears and pushed the price lower. In the case of a penetration below the £63.80 barrier will open the door for the £61.75 support level. Additionally, the technical indicators are moving lower. The RSI indicator is pointing to the downside into the bearish territory, while the MACD oscillator is dropping below the trigger and zero lines.
This member did not declare if he had a position on this financial instrument or a related financial instrument.
About author

Offline


Add a comment
Comments
0 comments on the analysis LLOYDS BANKING GRP. ORD 10P - Daily