LLOYDS BANKING GRP. ORD 10P - Daily - Technical analysis published on 09/18/2017 (GMT)
- Who voted?
- 698
- 0
- Timeframe : Daily

LLOYDS BANKING GRP. ORD 10P Chart
Are you looking for opportunities in European stocks?
DISCOVER LONDINIA OPPORTUNITIES...
DISCOVER LONDINIA OPPORTUNITIES...
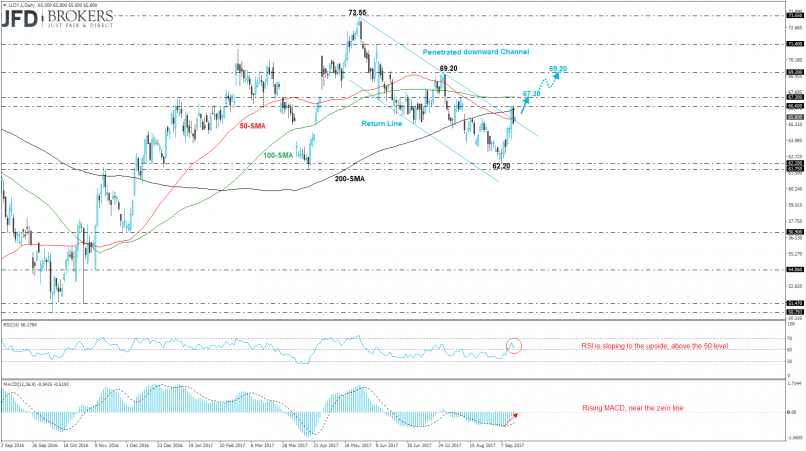
The Lloyds Bank (LSE: LLOY.L) plc is a British retail and commercial bank with branches across England and Wales. The stock price was developing within a downward sloping channel over the last three months, while during Thursday the price jumped higher until $66.60 resistance level.
From the technical point of view, the price slipped lower on Friday and lost some of the gains after the bounce off the 200-day SMA. The next level to have in mind is the $67.30 support barrier. Furthermore, a bullish run above $67.30, which overlaps with the 100-day SMA will open the way for the $69.20 resistance. The RSI indicator is slightly sloping north and the MACD oscillator is rising into the negative territory.
From the technical point of view, the price slipped lower on Friday and lost some of the gains after the bounce off the 200-day SMA. The next level to have in mind is the $67.30 support barrier. Furthermore, a bullish run above $67.30, which overlaps with the 100-day SMA will open the way for the $69.20 resistance. The RSI indicator is slightly sloping north and the MACD oscillator is rising into the negative territory.
This member declared not having a position on this financial instrument or a related financial instrument.
About author

Offline


Add a comment
Comments
0 comments on the analysis LLOYDS BANKING GRP. ORD 10P - Daily