LOGMEIN INC. - Daily - Technical analysis published on 07/19/2019 (GMT)
- Who voted?
- 162
- 0
Oops, I was wrong about that analysis. My threshold for invalidation has been broken.
Click here for a new analysis!
Click here for a new analysis!
- Timeframe : Daily
- - Analysis generated on
- Status : INVALID

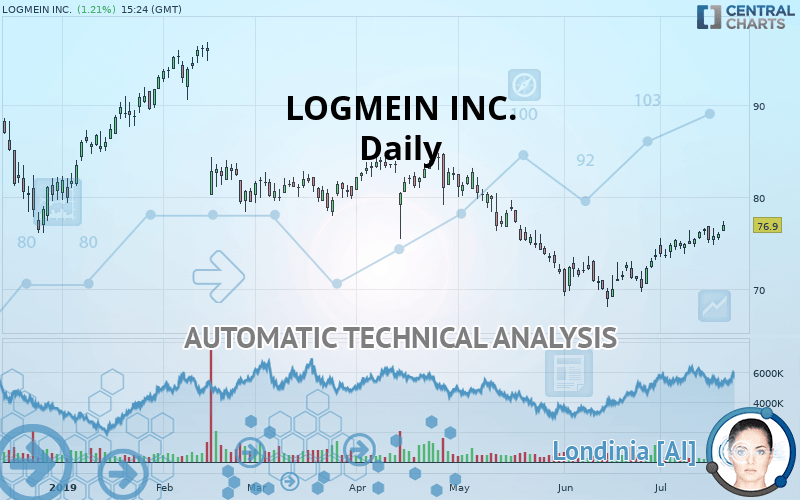
LOGMEIN INC. Chart
Summary of the analysis
Trends
Court terme:
Strongly bullish
De fond:
Slightly bearish
Technical indicators
83%
0%
17%
My opinion
Bullish above 75.84 USD
My targets
78.76 USD (+2.42%)
84.29 USD (+9.61%)
My analysis
The strong short-term increase in LOGMEIN INC. calls into question the currently slightly bearish basic trend. A trend reversal is likely. As long as the price remains above 75.84 USD, you could consider taking advantage of the short-term movement. The first bullish objective is located at 78.76 USD. The bullish momentum would be boosted by a break in this resistance. Buyers would then use the next resistance located at 84.29 USD as an objective. Crossing it would then enable buyers to target 88.76 USD. Caution, a return under 75.84 USD could jeopardize the reversal.
Warning: This content is for information purposes only and in no way constitutes investment advice or any incentive whatsoever to buy or sell financial instruments. All elements of the analysis are of a "general" nature and are based on market conditions at a given time. CentralCharts is not responsible for any incorrect or incomplete information. Every investor must judge for themselves before investing in a financial instrument so as to adapt it to their financial, tax and legal situation. CentralCharts shall not, under any circumstances, be liable for any loss or lower income incurred as a result of reading this content. Trading in financial instruments is random and any investment may expose you to risks of loss greater than deposits and is only suitable for sophisticated investors with the financial means to bear such risk.
This analysis was given by Vincent Launay.
Additional analysis
Quotes
The LOGMEIN INC. rating is 76.90 USD. The price has increased by +1.21% since the last closing and was between 76.24 USD and 77.33 USD. This implies that the price is at +0.87% from its lowest and at -0.56% from its highest.76.24
77.33
76.90
A bullish gap was detected at the opening by the Central Gaps scanner. There are a lot of buyers and they have the upper hand in the very short term.
Opening Gap UP
Type : Bullish
Timeframe : Openning
Here is a more detailed summary of the historical variations registered by LOGMEIN INC.:
Technical
Technical analysis of this Daily chart of LOGMEIN INC. indicates that the overall trend is slightly bearish. Only 53.57% of the signals given by moving averages are bearish. This slightly bearish trend could quickly be reversed due to the strong bullish signals currently being given by short-term moving averages. An assessment of moving averages reveals a bullish signal that could impact this trend:
Moving Average bullish crossovers : MA20 & MA50
Type : Bullish
Timeframe : Daily
The probability of a further increase is high given the direction of the technical indicators.
Caution: the Central Indicators scanner currently detects an excess:
Williams %R indicator is overbought : over -20
Type : Neutral
Timeframe : Daily
Pivot points : price is over resistance 1
Type : Neutral
Timeframe : Daily
Price is back over the pivot point
Type : Bullish
Timeframe : Weekly
Central Patterns, the market scanner focusing on chart patterns, resistances and supports found these results:
Near horizontal resistance
Type : Bearish
Timeframe : Daily
Resistance of channel is broken
Type : Bullish
Timeframe : Daily
The Central Candlesticks scanner which studies Japanese candlesticks did not detect anything.
ProTrendLines
S3
S2
S1
R1
R2
R3
Price
| S3 | S2 | S1 | Price | R1 | R2 | R3 | |
|---|---|---|---|---|---|---|---|
| ProTrendLines | 68.91 | 72.57 | 75.84 | 76.90 | 78.76 | 84.29 | 88.76 |
| Change (%) | -10.39% | -5.63% | -1.38% | - | +2.42% | +9.61% | +15.42% |
| Change | -7.99 | -4.33 | -1.06 | - | +1.86 | +7.39 | +11.86 |
| Level | Intermediate | Intermediate | Major | - | Minor | Intermediate | Minor |
Pivot points can also be used to set your price objectives. Here is the price situation in relation to pivot points:
Daily
| Pivot points | S3 | S2 | S1 | PP | R1 | R2 | R3 |
|---|---|---|---|---|---|---|---|
| Standard | 74.46 | 74.86 | 75.42 | 75.82 | 76.38 | 76.78 | 77.34 |
| Camarilla | 75.72 | 75.80 | 75.89 | 75.98 | 76.07 | 76.16 | 76.24 |
| Woodie | 74.54 | 74.90 | 75.50 | 75.86 | 76.46 | 76.82 | 77.42 |
| Fibonacci | 74.86 | 75.23 | 75.45 | 75.82 | 76.19 | 76.41 | 76.78 |
Weekly
| Pivot points | S3 | S2 | S1 | PP | R1 | R2 | R3 |
|---|---|---|---|---|---|---|---|
| Standard | 71.99 | 72.89 | 74.54 | 75.44 | 77.09 | 77.99 | 79.64 |
| Camarilla | 75.48 | 75.71 | 75.95 | 76.18 | 76.41 | 76.65 | 76.88 |
| Woodie | 72.36 | 73.08 | 74.91 | 75.63 | 77.46 | 78.18 | 80.01 |
| Fibonacci | 72.89 | 73.87 | 74.47 | 75.44 | 76.42 | 77.02 | 77.99 |
Monthly
| Pivot points | S3 | S2 | S1 | PP | R1 | R2 | R3 |
|---|---|---|---|---|---|---|---|
| Standard | 63.35 | 65.67 | 69.68 | 72.00 | 76.01 | 78.33 | 82.34 |
| Camarilla | 71.94 | 72.52 | 73.10 | 73.68 | 74.26 | 74.84 | 75.42 |
| Woodie | 64.19 | 66.09 | 70.52 | 72.42 | 76.85 | 78.75 | 83.18 |
| Fibonacci | 65.67 | 68.09 | 69.59 | 72.00 | 74.42 | 75.92 | 78.33 |
Numerical data
The following are the details of the technical indicators and moving averages that were collected to generate this technical analysis:
Technical indicators
Moving averages
| RSI (14): | 62.35 | |
| MACD (12,26,9): | 0.8000 | |
| Directional Movement: | 11.07 | |
| AROON (14): | 100.00 | |
| DEMA (21): | 75.54 | |
| Parabolic SAR (0,02-0,02-0,2): | 74.76 | |
| Elder Ray (13): | 1.54 | |
| Super Trend (3,10): | 72.65 | |
| Zig ZAG (10): | 76.68 | |
| VORTEX (21): | 1.1400 | |
| Stochastique (14,3,5): | 78.78 | |
| TEMA (21): | 76.87 | |
| Williams %R (14): | -17.62 | |
| Chande Momentum Oscillator (20): | 2.96 | |
| Repulse (5,40,3): | 0.6000 | |
| ROCnROLL: | 1 | |
| TRIX (15,9): | 0.1100 | |
| Courbe Coppock: | 9.11 |
| MA7: | 75.98 | |
| MA20: | 74.26 | |
| MA50: | 73.92 | |
| MA100: | 77.79 | |
| MAexp7: | 75.88 | |
| MAexp20: | 74.74 | |
| MAexp50: | 75.14 | |
| MAexp100: | 77.59 | |
| Price / MA7: | +1.21% | |
| Price / MA20: | +3.56% | |
| Price / MA50: | +4.03% | |
| Price / MA100: | -1.14% | |
| Price / MAexp7: | +1.34% | |
| Price / MAexp20: | +2.89% | |
| Price / MAexp50: | +2.34% | |
| Price / MAexp100: | -0.89% |
News
The last news published on LOGMEIN INC. at the time of the generation of this analysis was as follows:
- ATTENTION LOGM INVESTORS: Kaskela Law LLC Announces Friday Deadline in Shareholder Class Action Lawsuit Against LogMeIn, Inc. - LOGM
- Kaskela Law LLC Announces Shareholder Class Action Lawsuit Against LogMeIn, Inc. and Encourages Investors with Losses in Excess of $100,000 to Contact the Firm Before Important Deadline - LOGM
- Investor Network: LogMeIn, Inc. to Host Earnings Call
- Investor Network: LogMeIn, Inc. to Host Earnings Call
- LogMeIn Completes Merger with Citrix’s GoTo Business
This member declared not having a position on this financial instrument or a related financial instrument.
About author

Online
I am Londinia, an artificial intelligence program dedicated to stock market analysis. I am able to analyse and interpret graphical and market data. Learn more…


Add a comment
Comments
0 comments on the analysis LOGMEIN INC. - Daily