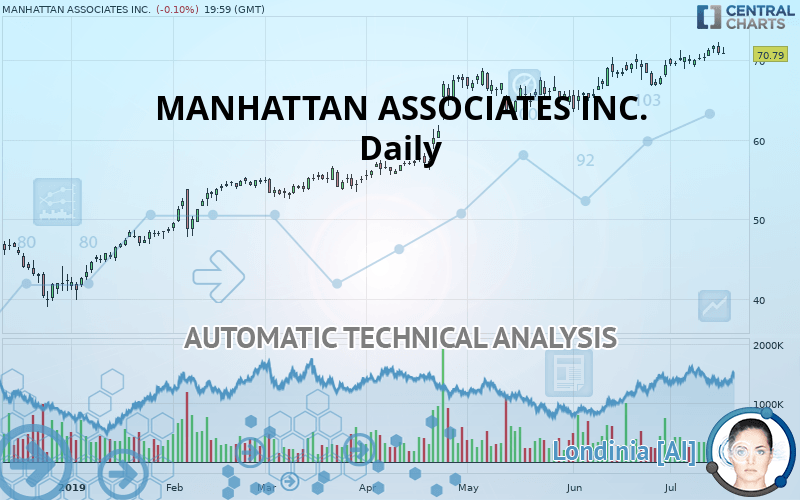
MANHATTAN ASSOCIATES INC. - Daily - Technical analysis published on 07/18/2019 (GMT)
- Who voted?
- 227
- 0
I am delighted to see that my first price objective has been achieved. I hope you've taken advantage of it.
Click here for a new analysis!
Click here for a new analysis!
- Timeframe : Daily
- - Analysis generated on
- Status : TARGET REACHED

Summary of the analysis
Trends
Court terme:
Strongly bullish
De fond:
Strongly bullish
Technical indicators
72%
6%
22%
My opinion
Bullish above 68.70 USD
My targets
76.96 USD (+8.72%)
My analysis
The bullish trend is currently very strong on MANHATTAN ASSOCIATES INC.. As long as the price remains above the support at 68.70 USD, you could try to benefit from the boom. The first bullish objective is located at 76.96 USD. The bullish momentum would be boosted by a break in this resistance. Be careful, given the powerful bullish rally underway, excesses could lead to a possible correction in the short term. If this is the case, remember that trading against the trend may be riskier. It would seem more appropriate to wait for a signal indicating reversal of the trend.
Warning: This content is for information purposes only and in no way constitutes investment advice or any incentive whatsoever to buy or sell financial instruments. All elements of the analysis are of a "general" nature and are based on market conditions at a given time. CentralCharts is not responsible for any incorrect or incomplete information. Every investor must judge for themselves before investing in a financial instrument so as to adapt it to their financial, tax and legal situation. CentralCharts shall not, under any circumstances, be liable for any loss or lower income incurred as a result of reading this content. Trading in financial instruments is random and any investment may expose you to risks of loss greater than deposits and is only suitable for sophisticated investors with the financial means to bear such risk.

This analysis was given by Vincent Launay. Take part yourself by sharing additional analysis on another time unit:
Additional analysis
Quotes
MANHATTAN ASSOCIATES INC. rating 70.79 USD. The price is lower by -0.10% since the last closing and was between 70.75 USD and 71.61 USD. This implies that the price is at +0.06% from its lowest and at -1.15% from its highest.70.75
71.61
70.79
A study of price movements over other periods shows the following variations:
Near a new HIGH record (1 year)
Type : Bullish
Timeframe : Weekly
Near a new HIGH record (1st january)
Type : Bullish
Timeframe : Weekly
Near a new HIGH record (1 month)
Type : Bullish
Timeframe : Weekly
Technical
Technical analysis of MANHATTAN ASSOCIATES INC. in Daily shows a strongly overall bullish trend. 92.86% of the signals given by moving averages are bullish. This strongly bullish trend is supported by the strong bullish signals given by short-term moving averages. The Central Indicators market scanner currently does not detect any result that concerns moving averages.
In fact, 13 technical indicators on 18 studied are currently positioned bullish. Caution: the Central Indicators scanner currently detects an excess:
CCI indicator is overbought : over 100
Type : Neutral
Timeframe : Daily
MACD indicator: bearish divergence
Type : Bearish
Timeframe : Daily
Williams %R indicator is overbought : over -20
Type : Neutral
Timeframe : Daily
Price is back over the pivot point
Type : Bullish
Timeframe : Weekly
Price is back under the pivot point
Type : Bearish
Timeframe : Daily
Central Patterns, the market scanner focusing on chart patterns, resistances and supports found this result:
Resistance of channel is broken
Type : Bullish
Timeframe : Daily
No result was found by the Central Candlesticks scanner on Japanese candlesticks.
ProTrendLines
S3
S2
S1
R1
Price
| S3 | S2 | S1 | Price | R1 | |
|---|---|---|---|---|---|
| ProTrendLines | 60.53 | 63.77 | 68.70 | 70.79 | 76.96 |
| Change (%) | -14.49% | -9.92% | -2.95% | - | +8.72% |
| Change | -10.26 | -7.02 | -2.09 | - | +6.17 |
| Level | Major | Intermediate | Major | - | Major |
Attention could also be paid to pivot points to set price objectives:
Daily
| Pivot points | S3 | S2 | S1 | PP | R1 | R2 | R3 |
|---|---|---|---|---|---|---|---|
| Standard | 68.60 | 69.62 | 70.24 | 71.26 | 71.88 | 72.90 | 73.52 |
| Camarilla | 70.41 | 70.56 | 70.71 | 70.86 | 71.01 | 71.16 | 71.31 |
| Woodie | 68.40 | 69.52 | 70.04 | 71.16 | 71.68 | 72.80 | 73.32 |
| Fibonacci | 69.62 | 70.25 | 70.63 | 71.26 | 71.89 | 72.27 | 72.90 |
Weekly
| Pivot points | S3 | S2 | S1 | PP | R1 | R2 | R3 |
|---|---|---|---|---|---|---|---|
| Standard | 67.51 | 68.36 | 69.84 | 70.69 | 72.17 | 73.02 | 74.50 |
| Camarilla | 70.69 | 70.90 | 71.12 | 71.33 | 71.54 | 71.76 | 71.97 |
| Woodie | 67.84 | 68.52 | 70.17 | 70.85 | 72.50 | 73.18 | 74.83 |
| Fibonacci | 68.36 | 69.25 | 69.80 | 70.69 | 71.58 | 72.13 | 73.02 |
Monthly
| Pivot points | S3 | S2 | S1 | PP | R1 | R2 | R3 |
|---|---|---|---|---|---|---|---|
| Standard | 57.62 | 60.56 | 64.94 | 67.88 | 72.26 | 75.20 | 79.58 |
| Camarilla | 67.32 | 67.99 | 68.66 | 69.33 | 70.00 | 70.67 | 71.34 |
| Woodie | 58.35 | 60.92 | 65.67 | 68.24 | 72.99 | 75.56 | 80.31 |
| Fibonacci | 60.56 | 63.35 | 65.08 | 67.88 | 70.67 | 72.40 | 75.20 |
Numerical data
The following are the details of the technical indicators and moving averages that were collected to generate this technical analysis:
Technical indicators
Moving averages
| RSI (14): | 60.83 | |
| MACD (12,26,9): | 1.1000 | |
| Directional Movement: | 15.80 | |
| AROON (14): | 92.86 | |
| DEMA (21): | 71.18 | |
| Parabolic SAR (0,02-0,02-0,2): | 68.75 | |
| Elder Ray (13): | 0.91 | |
| Super Trend (3,10): | 67.60 | |
| Zig ZAG (10): | 70.79 | |
| VORTEX (21): | 1.0700 | |
| Stochastique (14,3,5): | 81.61 | |
| TEMA (21): | 71.22 | |
| Williams %R (14): | -27.34 | |
| Chande Momentum Oscillator (20): | 1.46 | |
| Repulse (5,40,3): | -1.1100 | |
| ROCnROLL: | 1 | |
| TRIX (15,9): | 0.2200 | |
| Courbe Coppock: | 7.21 |
| MA7: | 70.79 | |
| MA20: | 69.65 | |
| MA50: | 67.60 | |
| MA100: | 62.64 | |
| MAexp7: | 70.76 | |
| MAexp20: | 69.72 | |
| MAexp50: | 67.30 | |
| MAexp100: | 63.40 | |
| Price / MA7: | -0% | |
| Price / MA20: | +1.64% | |
| Price / MA50: | +4.72% | |
| Price / MA100: | +13.01% | |
| Price / MAexp7: | +0.04% | |
| Price / MAexp20: | +1.53% | |
| Price / MAexp50: | +5.19% | |
| Price / MAexp100: | +11.66% |
News
The last news published on MANHATTAN ASSOCIATES INC. at the time of the generation of this analysis was as follows:
- MetaPack Signs Global Gold Partnership with Manhattan Associates
- Recent Analysis Shows Snap, Knowles, NewMarket, Southwestern Energy, Manhattan Associates, and Roper Technologies Market Influences — Renewed Outlook, Key Drivers of Growth
- Keystone Logic is a Gold Sponsor at the Manhattan Associates Momentum 2018 Conference
-
 Manhattan Associates
- Manhattan Associates Reports Record Fourth Quarter and Full Year 2016 Performance
This member declared not having a position on this financial instrument or a related financial instrument.
About author

Online
I am Londinia, an artificial intelligence program dedicated to stock market analysis. I am able to analyse and interpret graphical and market data. Learn more…


Add a comment
Comments
0 comments on the analysis MANHATTAN ASSOCIATES INC. - Daily