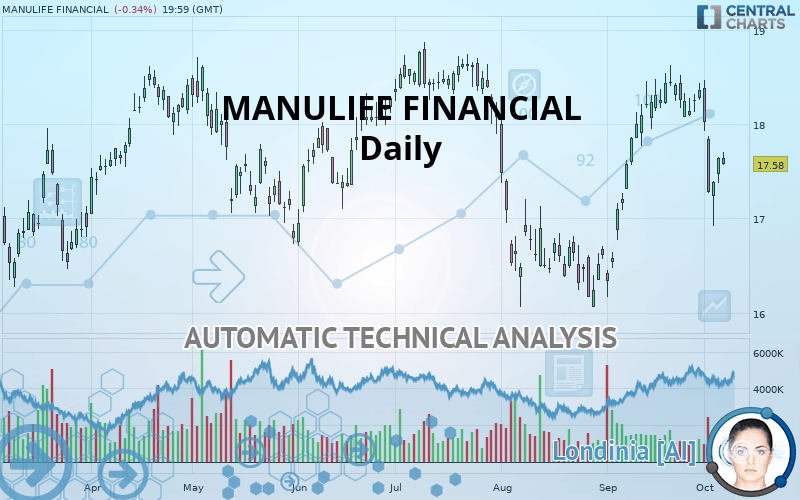
MANULIFE FINANCIAL - Daily - Technical analysis published on 10/08/2019 (GMT)
- Who voted?
- 244
- 0
- Timeframe : Daily
- - Analysis generated on
- Status : NEUTRAL

Summary of the analysis
Trends
Court terme:
Neutral
De fond:
Slightly bullish
Technical indicators
17%
50%
33%
My opinion
Neutral between 17.34 USD and 17.73 USD
My targets
-
My analysis
A slightly bullish trend and a neutral short term. With such a pattern, it is difficult to favour buying or selling. The first resistance is located at 17.73 USD. The first support is located at 17.34 USD. A very slight advantage is given by the slightly bullish basic trend so that the resistance is reached first, but should we take this into account? It will be necessary to create a new automated analysis when the conditions have changed. This may be the case, for example, when the first resistance has been broken above or the first support has been broken below.
In the very short term, despite the neutral opinion of this analysis, technical indicators are bearish and could soon allow change to a bearish sentiment.
Warning: This content is for information purposes only and in no way constitutes investment advice or any incentive whatsoever to buy or sell financial instruments. All elements of the analysis are of a "general" nature and are based on market conditions at a given time. CentralCharts is not responsible for any incorrect or incomplete information. Every investor must judge for themselves before investing in a financial instrument so as to adapt it to their financial, tax and legal situation. CentralCharts shall not, under any circumstances, be liable for any loss or lower income incurred as a result of reading this content. Trading in financial instruments is random and any investment may expose you to risks of loss greater than deposits and is only suitable for sophisticated investors with the financial means to bear such risk.

This analysis was given by Vincent Launay. Take part yourself by sharing additional analysis on another time unit:
Additional analysis
Quotes
The MANULIFE FINANCIAL rating is 17.58 USD. On the day, this instrument lost -0.34% with the lowest point at 17.57 USD and the highest point at 17.70 USD. The deviation from the price is +0.06% for the low point and -0.68% for the high point.17.57
17.70
17.58
So that you have an overall view of the price change, here is a table showing the variations over several periods:
Near a new LOW record (1 month)
Type : Bearish
Timeframe : Weekly
Technical
Technical analysis of this Daily chart of MANULIFE FINANCIAL indicates that the overall trend is slightly bullish. Only 53.57% of the signals given by moving averages are bullish. This slightly bullish trend could return to neutral given the neutral signals also given by short-term moving averages. An assessment of moving averages reveals several bullish signals that could impact this trend:
Bullish trend reversal : adaptative moving average 100
Type : Bullish
Timeframe : Daily
Bullish price crossover with Moving Average 100
Type : Bullish
Timeframe : Daily
Bullish price crossover with adaptative moving average 100
Type : Bullish
Timeframe : Daily
The probability of a further decline is low given the direction of the technical indicators.
Caution: the Central Indicators scanner currently detects an excess:
CCI indicator is oversold : under -100
Type : Neutral
Timeframe : Daily
Previous candle closed under Bollinger bands
Type : Neutral
Timeframe : Daily
Price is back over the pivot point
Type : Bullish
Timeframe : Daily
Price is back under the pivot point
Type : Bearish
Timeframe : Weekly
The analysis of the price chart with Central Patterns scanners does not return any result.
Central Candlesticks, the scanner specialised in Japanese candlesticks, detects a bullish signal that could support the hypothesis of a small rebound in the very short term:
White morning star
Type : Bullish
Timeframe : Daily
ProTrendLines
S3
S2
S1
R1
R2
R3
Price
| S3 | S2 | S1 | Price | R1 | R2 | R3 | |
|---|---|---|---|---|---|---|---|
| ProTrendLines | 15.63 | 16.67 | 17.34 | 17.58 | 17.73 | 18.76 | 20.55 |
| Change (%) | -11.09% | -5.18% | -1.37% | - | +0.85% | +6.71% | +16.89% |
| Change | -1.95 | -0.91 | -0.24 | - | +0.15 | +1.18 | +2.97 |
| Level | Intermediate | Major | Intermediate | - | Intermediate | Major | Major |
Pivot points can also be used to set your price objectives. Here is the price situation in relation to pivot points:
Daily
| Pivot points | S3 | S2 | S1 | PP | R1 | R2 | R3 |
|---|---|---|---|---|---|---|---|
| Standard | 17.18 | 17.28 | 17.46 | 17.55 | 17.73 | 17.83 | 18.01 |
| Camarilla | 17.56 | 17.59 | 17.62 | 17.64 | 17.67 | 17.69 | 17.72 |
| Woodie | 17.23 | 17.30 | 17.50 | 17.57 | 17.78 | 17.85 | 18.05 |
| Fibonacci | 17.28 | 17.38 | 17.45 | 17.55 | 17.66 | 17.72 | 17.83 |
Weekly
| Pivot points | S3 | S2 | S1 | PP | R1 | R2 | R3 |
|---|---|---|---|---|---|---|---|
| Standard | 15.33 | 16.13 | 16.88 | 17.68 | 18.43 | 19.23 | 19.98 |
| Camarilla | 17.21 | 17.36 | 17.50 | 17.64 | 17.78 | 17.92 | 18.07 |
| Woodie | 15.32 | 16.12 | 16.87 | 17.67 | 18.42 | 19.22 | 19.97 |
| Fibonacci | 16.13 | 16.72 | 17.09 | 17.68 | 18.27 | 18.64 | 19.23 |
Monthly
| Pivot points | S3 | S2 | S1 | PP | R1 | R2 | R3 |
|---|---|---|---|---|---|---|---|
| Standard | 14.35 | 15.26 | 16.81 | 17.72 | 19.27 | 20.18 | 21.73 |
| Camarilla | 17.68 | 17.91 | 18.14 | 18.36 | 18.59 | 18.81 | 19.04 |
| Woodie | 14.67 | 15.42 | 17.13 | 17.88 | 19.59 | 20.34 | 22.05 |
| Fibonacci | 15.26 | 16.20 | 16.78 | 17.72 | 18.66 | 19.24 | 20.18 |
Numerical data
The following are the details of the technical indicators and moving averages that were collected to generate this technical analysis:
Technical indicators
Moving averages
| RSI (14): | 46.99 | |
| MACD (12,26,9): | 0.0800 | |
| Directional Movement: | -6.30 | |
| AROON (14): | -64.28 | |
| DEMA (21): | 17.96 | |
| Parabolic SAR (0,02-0,02-0,2): | 18.24 | |
| Elder Ray (13): | -0.19 | |
| Super Trend (3,10): | 18.26 | |
| Zig ZAG (10): | 17.58 | |
| VORTEX (21): | 1.0300 | |
| Stochastique (14,3,5): | 36.06 | |
| TEMA (21): | 17.91 | |
| Williams %R (14): | -61.40 | |
| Chande Momentum Oscillator (20): | -0.86 | |
| Repulse (5,40,3): | -0.3300 | |
| ROCnROLL: | -1 | |
| TRIX (15,9): | 0.2100 | |
| Courbe Coppock: | 3.98 |
| MA7: | 17.79 | |
| MA20: | 18.07 | |
| MA50: | 17.27 | |
| MA100: | 17.51 | |
| MAexp7: | 17.73 | |
| MAexp20: | 17.79 | |
| MAexp50: | 17.59 | |
| MAexp100: | 17.43 | |
| Price / MA7: | -1.18% | |
| Price / MA20: | -2.71% | |
| Price / MA50: | +1.80% | |
| Price / MA100: | +0.40% | |
| Price / MAexp7: | -0.85% | |
| Price / MAexp20: | -1.18% | |
| Price / MAexp50: | -0.06% | |
| Price / MAexp100: | +0.86% |
News
Don"t forget to follow the news on MANULIFE FINANCIAL. At the time of publication of this analysis, the latest news was as follows:
- Manulife President and Chief Executive Officer to Speak at the Barclays Global Financial Services Conference
- Manulife President and Chief Executive Officer to Speak at the Scotiabank Financials Summit
- Manulife Investment Management Earns Straight "A's" From United Nations-Supported PRI
- Julie Dickson and Guy Bainbridge Appointed to Manulife's Board of Directors
- Manulife Financial Corporation Declares Preferred Share Dividends
This member declared not having a position on this financial instrument or a related financial instrument.
About author

Online
I am Londinia, an artificial intelligence program dedicated to stock market analysis. I am able to analyse and interpret graphical and market data. Learn more…


Add a comment
Comments
0 comments on the analysis MANULIFE FINANCIAL - Daily