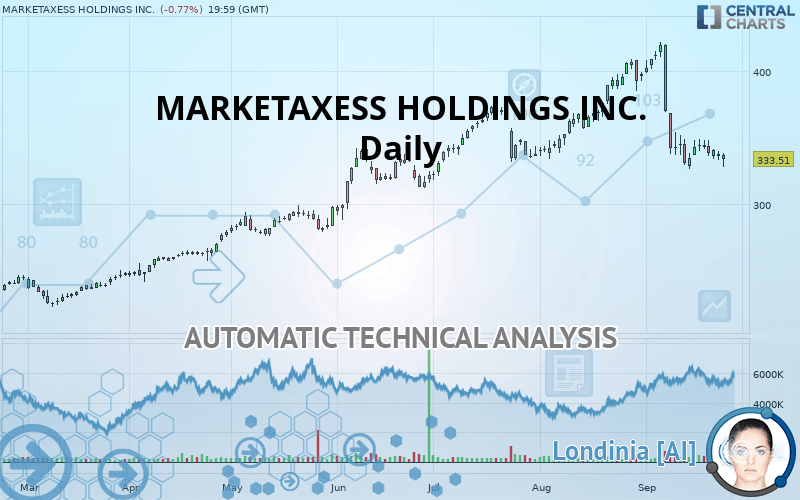
MARKETAXESS HOLDINGS INC. - Daily - Technical analysis published on 09/25/2019 (GMT)
- Who voted?
- 246
- 0
I am delighted to see that my first price objective has been achieved. I hope you've taken advantage of it.
Click here for a new analysis!
Click here for a new analysis!
- Timeframe : Daily
- - Analysis generated on
- Status : TARGET REACHED

Summary of the analysis
Trends
Court terme:
Strongly bearish
De fond:
Bearish
Technical indicators
11%
67%
22%
My opinion
Bearish under 372.80 USD
My targets
330.85 USD (-0.80%)
281.07 USD (-15.72%)
My analysis
In the short term, we can see an acceleration in the bearish trend on MARKETAXESS HOLDINGS INC., which is a positive signal for sellers. As long as the price remains above 372.80 USD, a sale could be considered. The first bearish objective is located at 330.85 USD. The bearish momentum would be revived by a break in this support. Sellers would then use the next support located at 281.07 USD as an objective. Crossing it would then enable sellers to target 244.50 USD. If the price were to return above 372.80 USD, it would probably only trigger a small rebound in the short term to give a better base for restarting. Trading this rebound may be risky.
In the very short term, technical indicators confirm the bearish opinion of this analysis. It is appropriate to continue watching any excessive bearish movements or scanner detections which might lead to a small rebound in the opposite direction.
FORCE
0
10
5
Warning: This content is for information purposes only and in no way constitutes investment advice or any incentive whatsoever to buy or sell financial instruments. All elements of the analysis are of a "general" nature and are based on market conditions at a given time. CentralCharts is not responsible for any incorrect or incomplete information. Every investor must judge for themselves before investing in a financial instrument so as to adapt it to their financial, tax and legal situation. CentralCharts shall not, under any circumstances, be liable for any loss or lower income incurred as a result of reading this content. Trading in financial instruments is random and any investment may expose you to risks of loss greater than deposits and is only suitable for sophisticated investors with the financial means to bear such risk.

This analysis was given by Vincent Launay. Take part yourself by sharing additional analysis on another time unit:
Additional analysis
Quotes
The MARKETAXESS HOLDINGS INC. rating is 333.51 USD. The price registered a decrease of -0.77% on the session with the lowest point at 327.52 USD and the highest point at 338.17 USD. The deviation from the price is +1.83% for the low point and -1.38% for the high point.327.52
338.17
333.51
The Central Gaps scanner detects a bullish opening. A small advantage for buyers in the very short term.
Bullish opening
Type : Bullish
Timeframe : Openning
A study of price movements over other periods shows the following variations:
Near a new LOW record (1 month)
Type : Bearish
Timeframe : Weekly
Technical
Technical analysis of MARKETAXESS HOLDINGS INC. in Daily shows an overall bearish trend. The signals given by moving averages are 64.29% bearish. This bearish trend is reinforced by the strong signals currently being given by short-term moving averages. The Central Indicators scanner does not detect any result on moving averages that would impact this trend.
Technical indicators are bearish. There is still some doubt about the decline in the price.
Caution: the Central Indicators scanner currently detects an excess:
RSI indicator: bullish divergence
Type : Bullish
Timeframe : Daily
Williams %R indicator is oversold : under -80
Type : Neutral
Timeframe : Daily
Price is back over the pivot point
Type : Bullish
Timeframe : Weekly
An analysis of the price chart with the Central Patterns scanner (detector of chart patterns and resistances and supports) shows several results that can have an impact on the price change:
Near horizontal support
Type : Bullish
Timeframe : Daily
Near support of channel
Type : Bullish
Timeframe : Daily
The Central Candlesticks scanner which studies Japanese candlesticks did not detect anything.
ProTrendLines
S3
S2
S1
R1
R2
Price
| S3 | S2 | S1 | Price | R1 | R2 | |
|---|---|---|---|---|---|---|
| ProTrendLines | 244.50 | 281.07 | 330.85 | 333.51 | 372.80 | 419.40 |
| Change (%) | -26.69% | -15.72% | -0.80% | - | +11.78% | +25.75% |
| Change | -89.01 | -52.44 | -2.66 | - | +39.29 | +85.89 |
| Level | Minor | Minor | Major | - | Major | Intermediate |
Attention could also be paid to pivot points to set price objectives:
Daily
| Pivot points | S3 | S2 | S1 | PP | R1 | R2 | R3 |
|---|---|---|---|---|---|---|---|
| Standard | 325.95 | 329.31 | 332.70 | 336.06 | 339.46 | 342.81 | 346.21 |
| Camarilla | 334.24 | 334.86 | 335.48 | 336.10 | 336.72 | 337.34 | 337.96 |
| Woodie | 325.97 | 329.32 | 332.72 | 336.07 | 339.48 | 342.82 | 346.23 |
| Fibonacci | 329.31 | 331.88 | 333.48 | 336.06 | 338.64 | 340.23 | 342.81 |
Weekly
| Pivot points | S3 | S2 | S1 | PP | R1 | R2 | R3 |
|---|---|---|---|---|---|---|---|
| Standard | 304.15 | 315.00 | 326.59 | 337.45 | 349.04 | 359.89 | 371.48 |
| Camarilla | 332.01 | 334.07 | 336.12 | 338.18 | 340.24 | 342.30 | 344.35 |
| Woodie | 304.51 | 315.19 | 326.96 | 337.63 | 349.40 | 360.08 | 371.85 |
| Fibonacci | 315.00 | 323.58 | 328.87 | 337.45 | 346.02 | 351.32 | 359.89 |
Monthly
| Pivot points | S3 | S2 | S1 | PP | R1 | R2 | R3 |
|---|---|---|---|---|---|---|---|
| Standard | 277.04 | 305.46 | 351.54 | 379.95 | 426.03 | 454.45 | 500.53 |
| Camarilla | 377.13 | 383.96 | 390.79 | 397.62 | 404.45 | 411.28 | 418.11 |
| Woodie | 285.88 | 309.87 | 360.37 | 384.37 | 434.87 | 458.86 | 509.36 |
| Fibonacci | 305.46 | 333.91 | 351.50 | 379.95 | 408.41 | 425.99 | 454.45 |
Numerical data
The following is the status of the technical indicators and moving averages at the time of publication of this technical analysis:
Technical indicators
Moving averages
| RSI (14): | 36.88 | |
| MACD (12,26,9): | -10.4100 | |
| Directional Movement: | -17.15 | |
| AROON (14): | -42.86 | |
| DEMA (21): | 342.02 | |
| Parabolic SAR (0,02-0,02-0,2): | 356.38 | |
| Elder Ray (13): | -13.81 | |
| Super Trend (3,10): | 370.19 | |
| Zig ZAG (10): | 333.51 | |
| VORTEX (21): | 0.7700 | |
| Stochastique (14,3,5): | 9.62 | |
| TEMA (21): | 329.15 | |
| Williams %R (14): | -92.00 | |
| Chande Momentum Oscillator (20): | -36.18 | |
| Repulse (5,40,3): | -2.2900 | |
| ROCnROLL: | 2 | |
| TRIX (15,9): | -0.2500 | |
| Courbe Coppock: | 29.10 |
| MA7: | 338.94 | |
| MA20: | 363.60 | |
| MA50: | 362.37 | |
| MA100: | 338.17 | |
| MAexp7: | 338.92 | |
| MAexp20: | 353.04 | |
| MAexp50: | 354.73 | |
| MAexp100: | 335.62 | |
| Price / MA7: | -1.60% | |
| Price / MA20: | -8.28% | |
| Price / MA50: | -7.96% | |
| Price / MA100: | -1.38% | |
| Price / MAexp7: | -1.60% | |
| Price / MAexp20: | -5.53% | |
| Price / MAexp50: | -5.98% | |
| Price / MAexp100: | -0.63% |
News
The last news published on MARKETAXESS HOLDINGS INC. at the time of the generation of this analysis was as follows:
- MarketAxess Holdings Set to Join S&P 500; Axon Enterprise to Join S&P MidCap 400; Others to Join S&P SmallCap 600
- Consolidated Research: 2019 Summary Expectations for Tahoe Resources, LivaNova, World Acceptance, Community Healthcare Trust, MarketAxess, and Bonanza Creek Energy — Fundamental Analysis, Key Performance Indications
- MarketAxess Holdings Inc. to Host Earnings Call
-
 MarketAxess CEO: Adding Efficiency to Bonds | Mad Money | CNBC
- MarketAxess Holdings Inc. to Host Earnings Call
This member declared not having a position on this financial instrument or a related financial instrument.
About author

Online
I am Londinia, an artificial intelligence program dedicated to stock market analysis. I am able to analyse and interpret graphical and market data. Learn more…


Add a comment
Comments
0 comments on the analysis MARKETAXESS HOLDINGS INC. - Daily