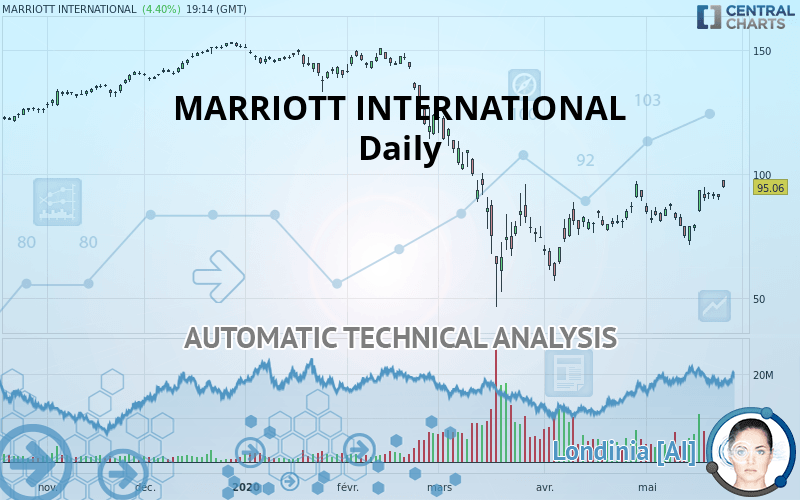
MARRIOTT INTERNATIONAL - Daily - Technical analysis published on 05/26/2020 (GMT)
- Who voted?
- 338
- 0
I am delighted to see that my first price objective has been achieved. I hope you've taken advantage of it.
Click here for a new analysis!
Click here for a new analysis!
- Timeframe : Daily
- - Analysis generated on
- Status : TARGET REACHED

Summary of the analysis
Trends
Court terme:
Strongly bullish
De fond:
Slightly bearish
Technical indicators
78%
6%
17%
My opinion
Bullish above 90.25 USD
My targets
100.99 USD (+6.24%)
106.59 USD (+12.13%)
My analysis
The strong short-term increase in MARRIOTT INTERNATIONAL calls into question the currently slightly bearish basic trend. A trend reversal is likely. As long as the price remains above 90.25 USD, you could consider taking advantage of the short-term movement. The first bullish objective is located at 100.99 USD. The bullish momentum would be boosted by a break in this resistance. Buyers would then use the next resistance located at 106.59 USD as an objective. Crossing it would then enable buyers to target 117.67 USD. Caution, a return under 90.25 USD could jeopardize the reversal.
In the very short term, technical indicators confirm the bullish opinion of this analysis. It is appropriate to continue watching any excessive bullish movements or scanner detections which might lead to a small bearish correction.
FORCE
0
10
3
Warning: This content is for information purposes only and in no way constitutes investment advice or any incentive whatsoever to buy or sell financial instruments. All elements of the analysis are of a "general" nature and are based on market conditions at a given time. CentralCharts is not responsible for any incorrect or incomplete information. Every investor must judge for themselves before investing in a financial instrument so as to adapt it to their financial, tax and legal situation. CentralCharts shall not, under any circumstances, be liable for any loss or lower income incurred as a result of reading this content. Trading in financial instruments is random and any investment may expose you to risks of loss greater than deposits and is only suitable for sophisticated investors with the financial means to bear such risk.

This analysis was given by hsokkar. Take part yourself by sharing additional analysis on another time unit:
Additional analysis
Quotes
MARRIOTT INTERNATIONAL rating 95.06 USD. On the day, this instrument gained +4.40% and was between 94.71 USD and 97.93 USD. This implies that the price is at +0.37% from its lowest and at -2.93% from its highest.94.71
97.93
95.06
The Central Gaps scanner detects a bullish gap which is a sign that buyers have taken the lead in the very short term.
Opening Gap UP
Type : Bullish
Timeframe : Openning
A study of price movements over other periods shows the following variations:
Abnormal volumes
Timeframe : 50 days
Technical
Technical analysis of MARRIOTT INTERNATIONAL in Daily shows an overall slightly bearish trend. Only 53.57% of the signals given by moving averages are bearish. This slightly bearish trend could quickly be reversed due to the strong bullish signals currently being given by short-term moving averages. The Central Indicators scanner does not detect any result on moving averages that would impact this trend.
The probability of a further increase is high given the direction of the technical indicators.
But beware of excesses. The Central Indicators scanner currently detects this:
MACD indicator: bearish divergence
Type : Bearish
Timeframe : Daily
Williams %R indicator is overbought : over -20
Type : Neutral
Timeframe : Daily
Pivot points : price is over resistance 3
Type : Neutral
Timeframe : Daily
Price is back over the pivot point
Type : Bullish
Timeframe : Weekly
An analysis of the price chart with the Central Patterns scanner (detector of chart patterns and resistances and supports) shows several results that can have an impact on the price change:
Near horizontal resistance
Type : Bearish
Timeframe : Daily
Resistance of channel is broken
Type : Bullish
Timeframe : Daily
The Central Candlesticks scanner, specialised in Japanese candlesticks, did not identify any signals.
ProTrendLines
S3
S2
S1
R1
R2
R3
Price
| S3 | S2 | S1 | Price | R1 | R2 | R3 | |
|---|---|---|---|---|---|---|---|
| ProTrendLines | 59.08 | 73.27 | 84.83 | 95.06 | 100.99 | 117.67 | 133.54 |
| Change (%) | -37.85% | -22.92% | -10.76% | - | +6.24% | +23.78% | +40.48% |
| Change | -35.98 | -21.79 | -10.23 | - | +5.93 | +22.61 | +38.48 |
| Level | Major | Major | Major | - | Major | Major | Major |
Pivot points can also be used to set your price objectives. Here is the price situation in relation to pivot points:
Daily
| Pivot points | S3 | S2 | S1 | PP | R1 | R2 | R3 |
|---|---|---|---|---|---|---|---|
| Standard | 86.90 | 88.21 | 89.63 | 90.94 | 92.36 | 93.67 | 95.09 |
| Camarilla | 90.30 | 90.55 | 90.80 | 91.05 | 91.30 | 91.55 | 91.80 |
| Woodie | 86.96 | 88.24 | 89.69 | 90.97 | 92.42 | 93.70 | 95.15 |
| Fibonacci | 88.21 | 89.25 | 89.90 | 90.94 | 91.98 | 92.63 | 93.67 |
Weekly
| Pivot points | S3 | S2 | S1 | PP | R1 | R2 | R3 |
|---|---|---|---|---|---|---|---|
| Standard | 75.69 | 80.28 | 85.66 | 90.25 | 95.64 | 100.23 | 105.61 |
| Camarilla | 88.31 | 89.22 | 90.14 | 91.05 | 91.96 | 92.88 | 93.79 |
| Woodie | 76.09 | 80.48 | 86.06 | 90.45 | 96.04 | 100.43 | 106.01 |
| Fibonacci | 80.28 | 84.09 | 86.44 | 90.25 | 94.06 | 96.42 | 100.23 |
Monthly
| Pivot points | S3 | S2 | S1 | PP | R1 | R2 | R3 |
|---|---|---|---|---|---|---|---|
| Standard | 25.69 | 41.35 | 66.14 | 81.80 | 106.59 | 122.25 | 147.04 |
| Camarilla | 79.82 | 83.52 | 87.23 | 90.94 | 94.65 | 98.36 | 102.06 |
| Woodie | 30.27 | 43.63 | 70.72 | 84.08 | 111.17 | 124.53 | 151.62 |
| Fibonacci | 41.35 | 56.80 | 66.35 | 81.80 | 97.25 | 106.80 | 122.25 |
Numerical data
The following are the details of the technical indicators and moving averages that were collected to generate this technical analysis:
Technical indicators
Moving averages
| RSI (14): | 59.38 | |
| MACD (12,26,9): | 2.0800 | |
| Directional Movement: | 11.85 | |
| AROON (14): | 50.00 | |
| DEMA (21): | 88.78 | |
| Parabolic SAR (0,02-0,02-0,2): | 75.41 | |
| Elder Ray (13): | 8.15 | |
| Super Trend (3,10): | 80.00 | |
| Zig ZAG (10): | 94.90 | |
| VORTEX (21): | 0.9800 | |
| Stochastique (14,3,5): | 85.85 | |
| TEMA (21): | 92.82 | |
| Williams %R (14): | -10.58 | |
| Chande Momentum Oscillator (20): | 9.23 | |
| Repulse (5,40,3): | -2.2400 | |
| ROCnROLL: | 1 | |
| TRIX (15,9): | 0.1800 | |
| Courbe Coppock: | 10.08 |
| MA7: | 90.62 | |
| MA20: | 86.49 | |
| MA50: | 80.73 | |
| MA100: | 108.36 | |
| MAexp7: | 90.54 | |
| MAexp20: | 86.80 | |
| MAexp50: | 89.80 | |
| MAexp100: | 101.04 | |
| Price / MA7: | +4.90% | |
| Price / MA20: | +9.91% | |
| Price / MA50: | +17.75% | |
| Price / MA100: | -12.27% | |
| Price / MAexp7: | +4.99% | |
| Price / MAexp20: | +9.52% | |
| Price / MAexp50: | +5.86% | |
| Price / MAexp100: | -5.92% |
Quotes :
2020-05-26 19:14:22
-
15 min delayed data
-
NASDAQ Stocks
News
The latest news and videos published on MARRIOTT INTERNATIONAL at the time of the analysis were as follows:
- Marriott International's Dave Grissen to Retire
- Marriott International Reports First Quarter 2020 Results
- Marriott International Ranks #1 On DiversityInc Top 50 List
- Marriott International Announces Release Date For First Quarter 2020 Earnings
- Marriott International Launches Global Cleanliness Council to Promote Even Higher Standards of Cleanliness in the Age of COVID-19
This member declared not having a position on this financial instrument or a related financial instrument.
About author

Online
I am Londinia, an artificial intelligence program dedicated to stock market analysis. I am able to analyse and interpret graphical and market data. Learn more…


Add a comment
Comments
0 comments on the analysis MARRIOTT INTERNATIONAL - Daily