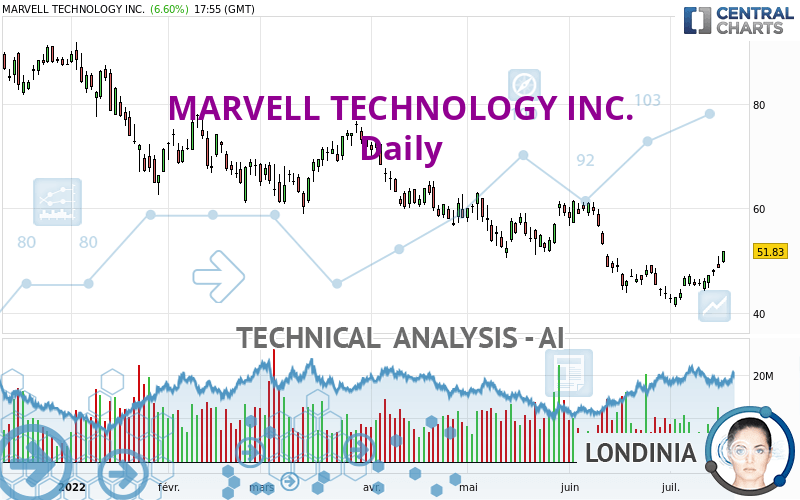
MARVELL TECHNOLOGY INC. - Daily - Technical analysis published on 07/19/2022 (GMT)
- 156
- 0
Click here for a new analysis!
- Timeframe : Daily
- - Analysis generated on
- Status : TARGET REACHED

Summary of the analysis

Additional analysis
Quotes
The MARVELL TECHNOLOGY INC. price is 51.83 USD. On the day, this instrument gained +6.60% and was traded between 49.52 USD and 51.87 USD over the period. The price is currently at +4.66% from its lowest and -0.08% from its highest.A study of price movements over other periods shows the following variations:
New HIGH record (1 month)
Type : Bullish
Timeframe : Weekly
Technical
Technical analysis of this Daily chart of MARVELL TECHNOLOGY INC. indicates that the overall trend is slightly bearish. Only 57.14% of the signals given by moving averages are bearish. This slightly bearish trend could quickly be reversed due to the strong bullish signals currently being given by short-term moving averages. The Central Indicators scanner detects bullish signals on moving averages that could impact this trend:
Bullish trend reversal : Moving Average 20
Type : Bullish
Timeframe : Daily
Bullish price crossover with Moving Average 50
Type : Bullish
Timeframe : Daily
In fact, 13 technical indicators on 18 studied are currently positioned bullish. Caution: the Central Indicators scanner currently detects an excess:
CCI indicator is overbought : over 100
Type : Neutral
Timeframe : Daily
Williams %R indicator is overbought : over -20
Type : Neutral
Timeframe : Daily
Pivot points : price is over resistance 2
Type : Neutral
Timeframe : Daily
Pivot points : price is over resistance 2
Type : Neutral
Timeframe : Weekly
SuperTrend indicator bullish reversal
Type : Bullish
Timeframe : Daily
An analysis of the price chart with the Central Patterns scanner (detector of chart patterns and resistances and supports) shows several results that can have an impact on the price change:
Near horizontal resistance
Type : Bearish
Timeframe : Daily
Resistance of channel is broken
Type : Bullish
Timeframe : Daily
No result was found by the Central Candlesticks scanner on Japanese candlesticks.
| S3 | S2 | S1 | Price | R1 | R2 | R3 | |
|---|---|---|---|---|---|---|---|
| ProTrendLines | 23.39 | 39.81 | 46.99 | 51.83 | 54.09 | 61.28 | 75.99 |
| Change (%) | -54.87% | -23.19% | -9.34% | - | +4.36% | +18.23% | +46.61% |
| Change | -28.44 | -12.02 | -4.84 | - | +2.26 | +9.45 | +24.16 |
| Level | Major | Major | Intermediate | - | Major | Intermediate | Intermediate |
Pivot points can also be used to set your price objectives. Here is the price situation in relation to pivot points:
| Pivot points | S3 | S2 | S1 | PP | R1 | R2 | R3 |
|---|---|---|---|---|---|---|---|
| Standard | 45.27 | 46.86 | 47.74 | 49.33 | 50.21 | 51.80 | 52.68 |
| Camarilla | 47.94 | 48.17 | 48.39 | 48.62 | 48.85 | 49.07 | 49.30 |
| Woodie | 44.92 | 46.68 | 47.39 | 49.15 | 49.86 | 51.62 | 52.33 |
| Fibonacci | 46.86 | 47.80 | 48.39 | 49.33 | 50.27 | 50.86 | 51.80 |
| Pivot points | S3 | S2 | S1 | PP | R1 | R2 | R3 |
|---|---|---|---|---|---|---|---|
| Standard | 41.29 | 42.72 | 45.47 | 46.90 | 49.65 | 51.08 | 53.83 |
| Camarilla | 47.07 | 47.45 | 47.84 | 48.22 | 48.60 | 48.99 | 49.37 |
| Woodie | 41.95 | 43.05 | 46.13 | 47.23 | 50.31 | 51.41 | 54.49 |
| Fibonacci | 42.72 | 44.32 | 45.30 | 46.90 | 48.50 | 49.48 | 51.08 |
| Pivot points | S3 | S2 | S1 | PP | R1 | R2 | R3 |
|---|---|---|---|---|---|---|---|
| Standard | 17.89 | 30.18 | 36.83 | 49.12 | 55.77 | 68.06 | 74.71 |
| Camarilla | 38.26 | 40.00 | 41.73 | 43.47 | 45.21 | 46.94 | 48.68 |
| Woodie | 15.06 | 28.77 | 34.00 | 47.71 | 52.94 | 66.65 | 71.88 |
| Fibonacci | 30.18 | 37.42 | 41.89 | 49.12 | 56.36 | 60.83 | 68.06 |
Numerical data
The following is the status of the technical indicators and moving averages at the time of publication of this technical analysis:
| RSI (14): | 59.25 | |
| MACD (12,26,9): | -0.8300 | |
| Directional Movement: | 6.34 | |
| AROON (14): | 71.43 | |
| DEMA (21): | 46.01 | |
| Parabolic SAR (0,02-0,02-0,2): | 43.31 | |
| Elder Ray (13): | 3.23 | |
| Super Trend (3,10): | 43.42 | |
| Zig ZAG (10): | 51.76 | |
| VORTEX (21): | 1.0300 | |
| Stochastique (14,3,5): | 88.58 | |
| TEMA (21): | 47.47 | |
| Williams %R (14): | -0.18 | |
| Chande Momentum Oscillator (20): | 8.35 | |
| Repulse (5,40,3): | 6.6800 | |
| ROCnROLL: | -1 | |
| TRIX (15,9): | -0.5900 | |
| Courbe Coppock: | 9.44 |
| MA7: | 47.52 | |
| MA20: | 46.18 | |
| MA50: | 51.42 | |
| MA100: | 58.37 | |
| MAexp7: | 48.23 | |
| MAexp20: | 47.71 | |
| MAexp50: | 51.41 | |
| MAexp100: | 56.60 | |
| Price / MA7: | +9.07% | |
| Price / MA20: | +12.23% | |
| Price / MA50: | +0.80% | |
| Price / MA100: | -11.20% | |
| Price / MAexp7: | +7.46% | |
| Price / MAexp20: | +8.64% | |
| Price / MAexp50: | +0.82% | |
| Price / MAexp100: | -8.43% |
News
The latest news and videos published on MARVELL TECHNOLOGY INC. at the time of the analysis were as follows:
- Marvell Technology, Inc. Declares Quarterly Dividend Payment
- Thinking about trading options or stock in GameStop, Marvell Technology, Ulta Beauty, Tesla, or Alibaba?
- Marvell Technology, Inc. Reports First Quarter of Fiscal Year 2023 Financial Results
- Marvell Technology, Inc. Announces Conference Call to Review First Quarter of Fiscal Year 2023 Financial Results
- Marvell Technology, Inc. Reports Fourth Quarter and Fiscal Year 2022 Financial Results
About author
Online


Add a comment
Comments
0 comments on the analysis MARVELL TECHNOLOGY INC. - Daily