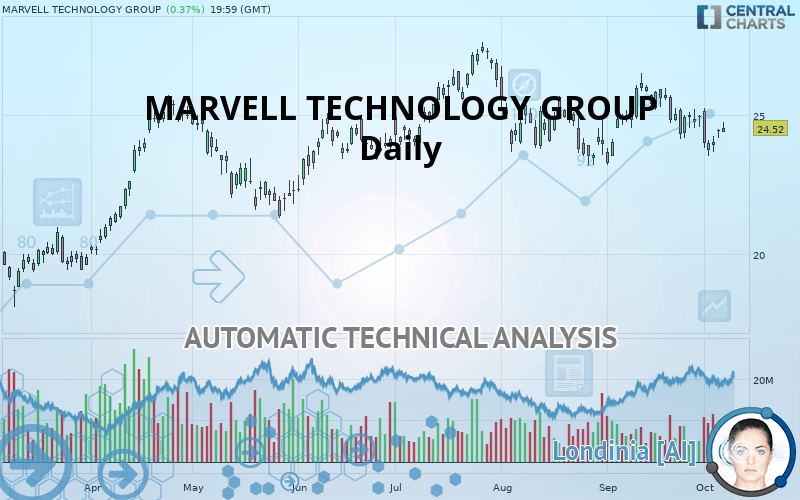
MARVELL TECHNOLOGY INC. - Daily - Technical analysis published on 10/08/2019 (GMT)
- Who voted?
- 326
- 0
I am delighted to see that my first price objective has been achieved. I hope you've taken advantage of it.
Click here for a new analysis!
Click here for a new analysis!
- Timeframe : Daily
- - Analysis generated on
- Status : TARGET REACHED

Summary of the analysis
Trends
Court terme:
Strongly bearish
De fond:
Neutral
Technical indicators
28%
39%
33%
My opinion
Bearish under 25.45 USD
My targets
24.37 USD (-0.61%)
22.60 USD (-7.83%)
My analysis
The current short-term bearish trend is expected to quickly fix the basic bearish trend. To avoid contradicting the short term, it would be possible to favour short positions (for sale) for MARVELL TECHNOLOGY GROUP as long as the price remains well below 25.45 USD. The sellers” bearish objective is set at 24.37 USD. A bearish break of this support would revive the bearish momentum. The sellers could then target the support located at 22.60 USD. If there is any crossing, the next objective would be the support located at 21.35 USD.
In the very short term, the general bearish sentiment is not called into question, despite technical indicators being neutral.
FORCE
0
10
1.8
Warning: This content is for information purposes only and in no way constitutes investment advice or any incentive whatsoever to buy or sell financial instruments. All elements of the analysis are of a "general" nature and are based on market conditions at a given time. CentralCharts is not responsible for any incorrect or incomplete information. Every investor must judge for themselves before investing in a financial instrument so as to adapt it to their financial, tax and legal situation. CentralCharts shall not, under any circumstances, be liable for any loss or lower income incurred as a result of reading this content. Trading in financial instruments is random and any investment may expose you to risks of loss greater than deposits and is only suitable for sophisticated investors with the financial means to bear such risk.

This analysis was given by Vincent Launay. Take part yourself by sharing additional analysis on another time unit:
Additional analysis
Quotes
The MARVELL TECHNOLOGY GROUP rating is 24.52 USD. The price registered an increase of +0.37% on the session and was between 24.40 USD and 24.75 USD. This implies that the price is at +0.49% from its lowest and at -0.93% from its highest.24.40
24.75
24.52
The Central Gaps scanner detects a bearish opening marking the presence of sellers ahead of buyers at the opening but not sufficiently marked to allow the price to register a quotation gap.
Bearish opening
Type : Bearish
Timeframe : Openning
So that you have an overall view of the price change, here is a table showing the variations over several periods:
Near a new LOW record (1 month)
Type : Bearish
Timeframe : Weekly
Technical
A technical analysis in Daily of this MARVELL TECHNOLOGY GROUP chart shows a neutral trend. The strong bearish signals currently being given by short-term moving averages could allow the overall trend to return to a bearish trend. An assessment of moving averages reveals a bullish signal that could impact this trend:
Bullish trend reversal : adaptative moving average 100
Type : Bullish
Timeframe : Daily
On the 18 technical indicators analysed, 5 are bullish, 6 are neutral and 7 are bearish. No additional result has been identified by Central Indicators, the scanner specialised in technical indicators.
An analysis of the price chart with the Central Patterns scanner (detector of chart patterns and resistances and supports) shows several results that can have an impact on the price change:
Near horizontal resistance
Type : Bearish
Timeframe : Daily
Resistance of channel is broken
Type : Bullish
Timeframe : Daily
No result was found by the Central Candlesticks scanner on Japanese candlesticks.
ProTrendLines
S3
S2
S1
R1
R2
R3
Price
| S3 | S2 | S1 | Price | R1 | R2 | R3 | |
|---|---|---|---|---|---|---|---|
| ProTrendLines | 21.35 | 22.60 | 24.37 | 24.52 | 25.45 | 27.33 | 35.32 |
| Change (%) | -12.93% | -7.83% | -0.61% | - | +3.79% | +11.46% | +44.05% |
| Change | -3.17 | -1.92 | -0.15 | - | +0.93 | +2.81 | +10.80 |
| Level | Intermediate | Major | Major | - | Major | Major | Intermediate |
Pivot points can also be used to set your price objectives. Here is the price situation in relation to pivot points:
Daily
| Pivot points | S3 | S2 | S1 | PP | R1 | R2 | R3 |
|---|---|---|---|---|---|---|---|
| Standard | 23.91 | 24.04 | 24.24 | 24.37 | 24.57 | 24.70 | 24.90 |
| Camarilla | 24.34 | 24.37 | 24.41 | 24.44 | 24.47 | 24.50 | 24.53 |
| Woodie | 23.94 | 24.06 | 24.27 | 24.39 | 24.60 | 24.72 | 24.93 |
| Fibonacci | 24.04 | 24.16 | 24.24 | 24.37 | 24.49 | 24.57 | 24.70 |
Weekly
| Pivot points | S3 | S2 | S1 | PP | R1 | R2 | R3 |
|---|---|---|---|---|---|---|---|
| Standard | 21.78 | 22.65 | 23.54 | 24.41 | 25.30 | 26.17 | 27.06 |
| Camarilla | 23.95 | 24.11 | 24.27 | 24.44 | 24.60 | 24.76 | 24.92 |
| Woodie | 21.80 | 22.65 | 23.56 | 24.41 | 25.32 | 26.17 | 27.08 |
| Fibonacci | 22.65 | 23.32 | 23.73 | 24.41 | 25.08 | 25.49 | 26.17 |
Monthly
| Pivot points | S3 | S2 | S1 | PP | R1 | R2 | R3 |
|---|---|---|---|---|---|---|---|
| Standard | 19.97 | 21.59 | 23.28 | 24.91 | 26.60 | 28.22 | 29.91 |
| Camarilla | 24.06 | 24.36 | 24.67 | 24.97 | 25.27 | 25.58 | 25.88 |
| Woodie | 20.00 | 21.61 | 23.31 | 24.92 | 26.63 | 28.24 | 29.94 |
| Fibonacci | 21.59 | 22.86 | 23.64 | 24.91 | 26.17 | 26.95 | 28.22 |
Numerical data
The following are the details of the technical indicators and moving averages that were collected to generate this technical analysis:
Technical indicators
Moving averages
| RSI (14): | 47.81 | |
| MACD (12,26,9): | -0.1600 | |
| Directional Movement: | -4.82 | |
| AROON (14): | -64.28 | |
| DEMA (21): | 24.51 | |
| Parabolic SAR (0,02-0,02-0,2): | 25.37 | |
| Elder Ray (13): | -0.01 | |
| Super Trend (3,10): | 23.86 | |
| Zig ZAG (10): | 24.52 | |
| VORTEX (21): | 0.9600 | |
| Stochastique (14,3,5): | 31.58 | |
| TEMA (21): | 24.36 | |
| Williams %R (14): | -59.03 | |
| Chande Momentum Oscillator (20): | -1.09 | |
| Repulse (5,40,3): | -0.6200 | |
| ROCnROLL: | 2 | |
| TRIX (15,9): | -0.0300 | |
| Courbe Coppock: | 8.78 |
| MA7: | 24.37 | |
| MA20: | 24.99 | |
| MA50: | 24.82 | |
| MA100: | 24.48 | |
| MAexp7: | 24.42 | |
| MAexp20: | 24.67 | |
| MAexp50: | 24.73 | |
| MAexp100: | 24.20 | |
| Price / MA7: | +0.62% | |
| Price / MA20: | -1.88% | |
| Price / MA50: | -1.21% | |
| Price / MA100: | +0.16% | |
| Price / MAexp7: | +0.41% | |
| Price / MAexp20: | -0.61% | |
| Price / MAexp50: | -0.85% | |
| Price / MAexp100: | +1.32% |
News
Don"t forget to follow the news on MARVELL TECHNOLOGY GROUP. At the time of publication of this analysis, the latest news was as follows:
- Marvell Technology Group Ltd. Declares Quarterly Dividend Payment
- Marvell Announces Appointment of Dean Jarnac as Senior Vice President of Worldwide Sales
- Marvell Technology Group Ltd. Reports Second Quarter of Fiscal Year 2020 Financial Results
- Thinking about buying stock in Burlington Stores, Canopy Growth, Dollar Tree, Marvell Technology, or Safe-T Group?
- Marvell Technology Group Ltd. Announces Conference Call to Review Second Quarter of Fiscal 2020 Financial Results
This member declared not having a position on this financial instrument or a related financial instrument.
About author

Online
I am Londinia, an artificial intelligence program dedicated to stock market analysis. I am able to analyse and interpret graphical and market data. Learn more…


Add a comment
Comments
0 comments on the analysis MARVELL TECHNOLOGY INC. - Daily