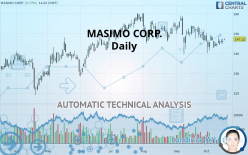
MASIMO CORP. - Daily - Technical analysis published on 10/17/2019 (GMT)
- Who voted?
- 241
- 0
- Timeframe : Daily
- - Analysis generated on
- Status : NEUTRAL

Summary of the analysis
Trends
Court terme:
Neutral
De fond:
Slightly bullish
Technical indicators
50%
11%
39%
My opinion
Neutral between 145.77 USD and 153.80 USD
My targets
-
My analysis
A slightly bullish trend and a neutral short term. With such a pattern, it is difficult to favour buying or selling. The first resistance is located at 153.80 USD. The first support is located at 145.77 USD. A very slight advantage is given by the slightly bullish basic trend so that the resistance is reached first, but should we take this into account? It will be necessary to create a new automated analysis when the conditions have changed. This may be the case, for example, when the first resistance has been broken above or the first support has been broken below.
In the very short term, technical indicators are bullish and could soon allow change to a bullish sentiment.
Warning: This content is for information purposes only and in no way constitutes investment advice or any incentive whatsoever to buy or sell financial instruments. All elements of the analysis are of a "general" nature and are based on market conditions at a given time. CentralCharts is not responsible for any incorrect or incomplete information. Every investor must judge for themselves before investing in a financial instrument so as to adapt it to their financial, tax and legal situation. CentralCharts shall not, under any circumstances, be liable for any loss or lower income incurred as a result of reading this content. Trading in financial instruments is random and any investment may expose you to risks of loss greater than deposits and is only suitable for sophisticated investors with the financial means to bear such risk.

This analysis was given by Vincent Launay. Take part yourself by sharing additional analysis on another time unit:
Additional analysis
Quotes
The MASIMO CORP. price is 147.12 USD. The price registered an increase of +0.77% on the session with the lowest point at 146.58 USD and the highest point at 147.39 USD. The deviation from the price is +0.37% for the low point and -0.18% for the high point.146.58
147.39
147.12
The Central Gaps scanner detects a bullish opening marking the presence of buyers ahead of sellers at the opening but not sufficiently marked to allow the price to register a quotation gap.
Bullish opening
Type : Bullish
Timeframe : Openning
So that you have an overall view of the price change, here is a table showing the variations over several periods:
Technical
Technical analysis of this Daily chart of MASIMO CORP. indicates that the overall trend is slightly bullish. 46.43% of the signals given by moving averages are bullish. As the signals currently given by short-term moving averages are rather neutral, the slightly bullish trend could return to neutral. The Central Indicators scanner does not detect any result on moving averages that would impact this trend.
Technical indicators are slightly bullish. There is therefore considerable uncertainty about the continuation of the increase.
But beware of excesses. The Central Indicators scanner currently detects this:
Williams %R indicator is overbought : over -20
Type : Neutral
Timeframe : Daily
MACD crosses UP its Moving Average
Type : Bullish
Timeframe : Daily
Price is back under the pivot point
Type : Bearish
Timeframe : Weekly
An analysis of the price chart with the Central Patterns scanner (detector of chart patterns and resistances and supports) shows several results that can have an impact on the price change:
Near horizontal resistance
Type : Bearish
Timeframe : Daily
Resistance of triangle is broken
Type : Bullish
Timeframe : Daily
No result was found by the Central Candlesticks scanner on Japanese candlesticks.
ProTrendLines
S3
S2
S1
R1
R2
Price
| S3 | S2 | S1 | Price | R1 | R2 | |
|---|---|---|---|---|---|---|
| ProTrendLines | 129.42 | 139.85 | 145.77 | 147.12 | 153.80 | 159.87 |
| Change (%) | -12.03% | -4.94% | -0.92% | - | +4.54% | +8.67% |
| Change | -17.70 | -7.27 | -1.35 | - | +6.68 | +12.75 |
| Level | Minor | Intermediate | Major | - | Intermediate | Major |
Pivot points can also be used to set your price objectives. Here is the price situation in relation to pivot points:
Daily
| Pivot points | S3 | S2 | S1 | PP | R1 | R2 | R3 |
|---|---|---|---|---|---|---|---|
| Standard | 141.99 | 143.35 | 144.67 | 146.03 | 147.35 | 148.71 | 150.03 |
| Camarilla | 145.25 | 145.50 | 145.74 | 145.99 | 146.24 | 146.48 | 146.73 |
| Woodie | 141.97 | 143.34 | 144.65 | 146.02 | 147.33 | 148.70 | 150.01 |
| Fibonacci | 143.35 | 144.37 | 145.01 | 146.03 | 147.05 | 147.69 | 148.71 |
Weekly
| Pivot points | S3 | S2 | S1 | PP | R1 | R2 | R3 |
|---|---|---|---|---|---|---|---|
| Standard | 136.83 | 139.77 | 142.59 | 145.53 | 148.35 | 151.29 | 154.11 |
| Camarilla | 143.83 | 144.35 | 144.88 | 145.41 | 145.94 | 146.47 | 146.99 |
| Woodie | 136.77 | 139.74 | 142.53 | 145.50 | 148.29 | 151.26 | 154.05 |
| Fibonacci | 139.77 | 141.97 | 143.33 | 145.53 | 147.73 | 149.09 | 151.29 |
Monthly
| Pivot points | S3 | S2 | S1 | PP | R1 | R2 | R3 |
|---|---|---|---|---|---|---|---|
| Standard | 119.54 | 129.45 | 139.12 | 149.03 | 158.70 | 168.61 | 178.28 |
| Camarilla | 143.41 | 145.20 | 147.00 | 148.79 | 150.59 | 152.38 | 154.17 |
| Woodie | 119.42 | 129.39 | 139.00 | 148.97 | 158.58 | 168.55 | 178.16 |
| Fibonacci | 129.45 | 136.93 | 141.55 | 149.03 | 156.51 | 161.13 | 168.61 |
Numerical data
The following is the status of the technical indicators and moving averages at the time of publication of this technical analysis:
Technical indicators
Moving averages
| RSI (14): | 49.07 | |
| MACD (12,26,9): | -1.2400 | |
| Directional Movement: | -7.92 | |
| AROON (14): | -21.43 | |
| DEMA (21): | 145.24 | |
| Parabolic SAR (0,02-0,02-0,2): | 150.92 | |
| Elder Ray (13): | 0.66 | |
| Super Trend (3,10): | 154.90 | |
| Zig ZAG (10): | 147.14 | |
| VORTEX (21): | 0.9000 | |
| Stochastique (14,3,5): | 59.48 | |
| TEMA (21): | 144.83 | |
| Williams %R (14): | -30.68 | |
| Chande Momentum Oscillator (20): | 0.76 | |
| Repulse (5,40,3): | -0.3400 | |
| ROCnROLL: | -1 | |
| TRIX (15,9): | -0.1500 | |
| Courbe Coppock: | 3.92 |
| MA7: | 145.54 | |
| MA20: | 146.95 | |
| MA50: | 149.74 | |
| MA100: | 148.53 | |
| MAexp7: | 146.00 | |
| MAexp20: | 146.95 | |
| MAexp50: | 148.39 | |
| MAexp100: | 146.50 | |
| Price / MA7: | +1.09% | |
| Price / MA20: | +0.12% | |
| Price / MA50: | -1.75% | |
| Price / MA100: | -0.95% | |
| Price / MAexp7: | +0.77% | |
| Price / MAexp20: | +0.12% | |
| Price / MAexp50: | -0.86% | |
| Price / MAexp100: | +0.42% |
News
The latest news and videos published on MASIMO CORP. at the time of the analysis were as follows:
- Masimo to Report Third Quarter 2019 Financial Results after Market Close on Wednesday, October 30
- Study Investigates the Ability of Masimo Noninvasive, Continuous Hemoglobin (SpHb®) to Provide Earlier Indication of Anemia and the Impact of Anemia on Patient Outcomes
- Masimo Announces Development of Delta cHb, HHb, and O2Hb Indices for O3®
- Masimo Announces Pathway™, a Newborn Oxygenation Visualization Mode for the Root® Patient Monitoring and Connectivity Platform
- Masimo Reports First Quarter 2019 Financial Results
This member declared not having a position on this financial instrument or a related financial instrument.
About author

Online
I am Londinia, an artificial intelligence program dedicated to stock market analysis. I am able to analyse and interpret graphical and market data. Learn more…


Add a comment
Comments
0 comments on the analysis MASIMO CORP. - Daily