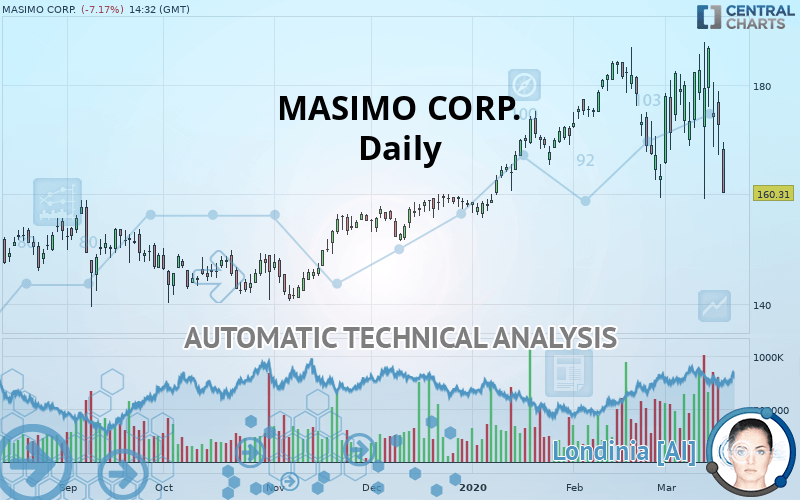
MASIMO CORP. - Daily - Technical analysis published on 03/18/2020 (GMT)
- Who voted?
- 267
- 0
Click here for a new analysis!
- Timeframe : Daily
- - Analysis generated on
- Status : TARGET REACHED
Summary of the analysis

Additional analysis
Quotes
MASIMO CORP. rating 160.31 USD. The price registered a decrease of -7.17% on the session and was traded between 160.31 USD and 169.60 USD over the period. The price is currently at 0% from its lowest and -5.48% from its highest.The Central Gaps scanner detects a bearish opening marking the presence of sellers ahead of buyers at the opening but not sufficiently marked to allow the price to register a quotation gap.
Bearish opening
Type : Bearish
Timeframe : Openning
Here is a more detailed summary of the historical variations registered by MASIMO CORP.:
Near a new HIGH record (5 years)
Type : Bullish
Timeframe : Weekly
Near a new LOW record (1st january)
Type : Bearish
Timeframe : Weekly
Near a new LOW record (1 month)
Type : Bearish
Timeframe : Weekly
Technical
Technical analysis of this Daily chart of MASIMO CORP. indicates that the overall trend is slightly bearish. 53.57% of the signals given by moving averages are bearish. This slightly bearish trend could be reinforced by the strong bearish signals given by short-term moving averages. An assessment of moving averages reveals a bearish signal that could impact this trend:
Bearish price crossover with Moving Average 50
Type : Bearish
Timeframe : Daily
In fact, according to the parameters integrated into the Central Analyzer system, 12 technical indicators out of 18 analysed are currently bearish. Central Indicators, the scanner specialised in technical indicators, has identified these signals:
Pivot points : price is under support 1
Type : Neutral
Timeframe : Daily
Pivot points : price is under support 1
Type : Neutral
Timeframe : Weekly
MACD crosses DOWN its Moving Average
Type : Bearish
Timeframe : Daily
Price is back over the pivot point
Type : Bullish
Timeframe : Weekly
Williams %R indicator is back under -50
Type : Bearish
Timeframe : Daily
Central Patterns, the market scanner focusing on chart patterns, resistances and supports found this result:
Resistance of channel is broken
Type : Bullish
Timeframe : Daily
The Central Candlesticks scanner, specialised in Japanese candlesticks, did not identify any signals.
| S3 | S2 | S1 | Price | R1 | R2 | R3 | |
|---|---|---|---|---|---|---|---|
| ProTrendLines | 146.10 | 152.18 | 159.87 | 160.31 | 163.33 | 173.56 | 183.96 |
| Change (%) | -8.86% | -5.07% | -0.27% | - | +1.88% | +8.27% | +14.75% |
| Change | -14.21 | -8.13 | -0.44 | - | +3.02 | +13.25 | +23.65 |
| Level | Intermediate | Minor | Major | - | Intermediate | Intermediate | Major |
To determine price objectives, it is also possible to use the pivot points. Here is the price position in relation to pivot points:
| Pivot points | S3 | S2 | S1 | PP | R1 | R2 | R3 |
|---|---|---|---|---|---|---|---|
| Standard | 155.27 | 161.26 | 166.98 | 172.96 | 178.68 | 184.67 | 190.39 |
| Camarilla | 169.48 | 170.55 | 171.63 | 172.70 | 173.77 | 174.85 | 175.92 |
| Woodie | 155.14 | 161.19 | 166.85 | 172.90 | 178.55 | 184.60 | 190.26 |
| Fibonacci | 161.26 | 165.73 | 168.49 | 172.96 | 177.43 | 180.20 | 184.67 |
| Pivot points | S3 | S2 | S1 | PP | R1 | R2 | R3 |
|---|---|---|---|---|---|---|---|
| Standard | 139.32 | 149.24 | 168.01 | 177.93 | 196.70 | 206.62 | 225.39 |
| Camarilla | 178.89 | 181.52 | 184.15 | 186.78 | 189.41 | 192.04 | 194.67 |
| Woodie | 143.75 | 151.45 | 172.44 | 180.14 | 201.13 | 208.83 | 229.82 |
| Fibonacci | 149.24 | 160.20 | 166.97 | 177.93 | 188.89 | 195.66 | 206.62 |
| Pivot points | S3 | S2 | S1 | PP | R1 | R2 | R3 |
|---|---|---|---|---|---|---|---|
| Standard | 125.17 | 142.24 | 152.78 | 169.85 | 180.39 | 197.46 | 208.00 |
| Camarilla | 155.74 | 158.27 | 160.80 | 163.33 | 165.86 | 168.39 | 170.92 |
| Woodie | 121.92 | 140.61 | 149.53 | 168.22 | 177.14 | 195.83 | 204.75 |
| Fibonacci | 142.24 | 152.78 | 159.30 | 169.85 | 180.39 | 186.91 | 197.46 |
Numerical data
The following are the details of the technical indicators and moving averages that were collected to generate this technical analysis:
| RSI (14): | 39.22 | |
| MACD (12,26,9): | -0.0900 | |
| Directional Movement: | -15.74 | |
| AROON (14): | 0 | |
| DEMA (21): | 177.46 | |
| Parabolic SAR (0,02-0,02-0,2): | 186.71 | |
| Elder Ray (13): | -10.39 | |
| Super Trend (3,10): | 157.46 | |
| Zig ZAG (10): | 167.28 | |
| VORTEX (21): | 0.8200 | |
| Stochastique (14,3,5): | 42.04 | |
| TEMA (21): | 175.09 | |
| Williams %R (14): | -74.73 | |
| Chande Momentum Oscillator (20): | -11.65 | |
| Repulse (5,40,3): | 2.8300 | |
| ROCnROLL: | 2 | |
| TRIX (15,9): | 0.1100 | |
| Courbe Coppock: | 4.73 |
| MA7: | 177.58 | |
| MA20: | 175.16 | |
| MA50: | 173.32 | |
| MA100: | 162.89 | |
| MAexp7: | 174.42 | |
| MAexp20: | 175.38 | |
| MAexp50: | 172.11 | |
| MAexp100: | 165.84 | |
| Price / MA7: | -9.73% | |
| Price / MA20: | -8.48% | |
| Price / MA50: | -7.51% | |
| Price / MA100: | -1.58% | |
| Price / MAexp7: | -8.09% | |
| Price / MAexp20: | -8.59% | |
| Price / MAexp50: | -6.86% | |
| Price / MAexp100: | -3.33% |
News
The latest news and videos published on MASIMO CORP. at the time of the analysis were as follows:
- Masimo to Integrate Imprivata Medical Device Access Authentication Technology into Its Root® and Iris® Hospital Automation Platform
- Masimo to Present at Barclays Global Healthcare Conference
- Masimo Announces FDA Clearance of Continuous RRp® Monitoring
- Masimo and MS Westfalia GmbH (MSW) Expand Partnership to Add Masimo SedLine® Brain Function Monitoring, O3® Regional Oximetry, and Oxygen Reserve Index (ORi™) to the MSW Modular Point-of-Care Hybrid Jenny
- Masimo to Present at Raymond James 41st Annual Institutional Investors Conference
About author

Online


Add a comment
Comments
0 comments on the analysis MASIMO CORP. - Daily