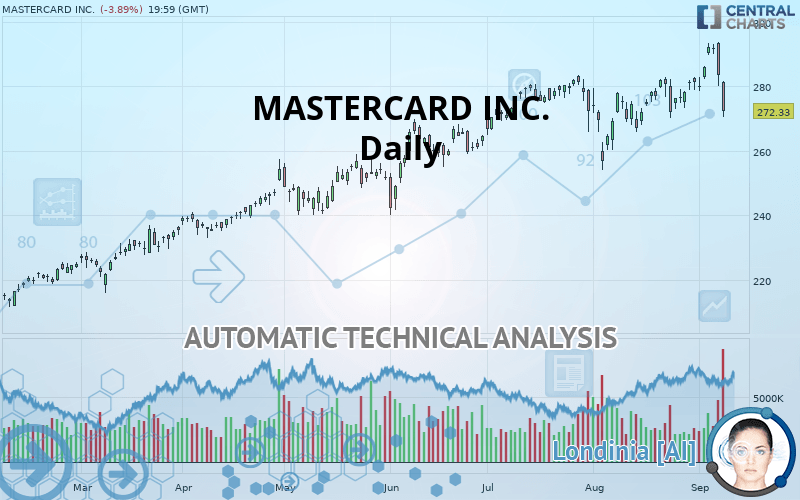
MASTERCARD INC. - Daily - Technical analysis published on 09/11/2019 (GMT)
- Who voted?
- 308
- 0
- Timeframe : Daily
- - Analysis generated on
- Status : NEUTRAL

Summary of the analysis
Trends
Court terme:
Bearish
De fond:
Slightly bullish
Technical indicators
28%
33%
39%
My opinion
Neutral between 256.86 USD and 282.07 USD
My targets
-
My analysis
The short-term decline on MASTERCARD INC. remains moderate but it could call into question the slightly bullish basic trend. It is difficult to advise a trading direction under these conditions. The first support is located at 256.86 USD. The first resistance is located at 282.07 USD. You could remain on the sidelines waiting for a more pronounced price movement on this instrument. A new analysis could then be carried out to provide clearer signals.
Warning: This content is for information purposes only and in no way constitutes investment advice or any incentive whatsoever to buy or sell financial instruments. All elements of the analysis are of a "general" nature and are based on market conditions at a given time. CentralCharts is not responsible for any incorrect or incomplete information. Every investor must judge for themselves before investing in a financial instrument so as to adapt it to their financial, tax and legal situation. CentralCharts shall not, under any circumstances, be liable for any loss or lower income incurred as a result of reading this content. Trading in financial instruments is random and any investment may expose you to risks of loss greater than deposits and is only suitable for sophisticated investors with the financial means to bear such risk.

This analysis was given by emerick. Take part yourself by sharing additional analysis on another time unit:
Additional analysis
Quotes
MASTERCARD INC. rating 272.33 USD. The price is lower by -3.89% since the last closing and was traded between 270.34 USD and 281.50 USD over the period. The price is currently at +0.74% from its lowest and -3.26% from its highest.270.34
281.50
272.33
A bearish opening was detected by the Central Gaps scanner. Sellers are trying to impose a bearish trend in the very short term.
Bearish opening
Type : Bearish
Timeframe : Openning
A study of price movements over other periods shows the following variations:
New HIGH record (5 years)
Type : Bullish
Timeframe : Weekly
Near a new HIGH record (1 year)
Type : Bullish
Timeframe : Weekly
Near a new HIGH record (1st january)
Type : Bullish
Timeframe : Weekly
Technical
Technical analysis of MASTERCARD INC. in Daily shows an overall slightly bullish trend. 60.71% of the signals given by moving averages are bullish. Caution: the slightly bearish signals currently given by short-term moving averages indicate that this slightly bullish trend could be reversed. The Central Indicators market scanner currently does not detect any result that concerns moving averages.
An assessment of technical indicators does not currently provide any relevant information on the direction of future price movements.
Caution: the Central Indicators scanner currently detects an excess:
Previous candle closed over Bollinger bands
Type : Neutral
Timeframe : Daily
Pivot points : price is under support 1
Type : Neutral
Timeframe : Daily
Pivot points : price is under support 3
Type : Neutral
Timeframe : Weekly
Parabolic SAR indicator bearish reversal
Type : Bearish
Timeframe : Daily
Price is back over the pivot point
Type : Bullish
Timeframe : Weekly
Central Patterns, the market scanner focusing on chart patterns, resistances and supports found this result:
Near support of channel
Type : Bullish
Timeframe : Daily
The Central Candlesticks scanner which studies Japanese candlesticks did not detect anything.
ProTrendLines
S3
S2
S1
R1
Price
| S3 | S2 | S1 | Price | R1 | |
|---|---|---|---|---|---|
| ProTrendLines | 223.77 | 241.82 | 256.86 | 272.33 | 282.07 |
| Change (%) | -17.83% | -11.20% | -5.68% | - | +3.58% |
| Change | -48.56 | -30.51 | -15.47 | - | +9.74 |
| Level | Major | Intermediate | Major | - | Major |
To determine price objectives, it is also possible to use the pivot points. Here is the price position in relation to pivot points:
Daily
| Pivot points | S3 | S2 | S1 | PP | R1 | R2 | R3 |
|---|---|---|---|---|---|---|---|
| Standard | 264.15 | 272.13 | 277.74 | 285.72 | 291.33 | 299.31 | 304.92 |
| Camarilla | 279.62 | 280.87 | 282.11 | 283.36 | 284.61 | 285.85 | 287.10 |
| Woodie | 262.98 | 271.54 | 276.57 | 285.13 | 290.16 | 298.72 | 303.75 |
| Fibonacci | 272.13 | 277.32 | 280.53 | 285.72 | 290.91 | 294.12 | 299.31 |
Weekly
| Pivot points | S3 | S2 | S1 | PP | R1 | R2 | R3 |
|---|---|---|---|---|---|---|---|
| Standard | 267.14 | 272.82 | 282.10 | 287.78 | 297.06 | 302.74 | 312.02 |
| Camarilla | 287.27 | 288.64 | 290.01 | 291.38 | 292.75 | 294.12 | 295.49 |
| Woodie | 268.94 | 273.72 | 283.90 | 288.68 | 298.86 | 303.64 | 313.82 |
| Fibonacci | 272.82 | 278.54 | 282.07 | 287.78 | 293.50 | 297.03 | 302.74 |
Monthly
| Pivot points | S3 | S2 | S1 | PP | R1 | R2 | R3 |
|---|---|---|---|---|---|---|---|
| Standard | 233.47 | 243.68 | 262.53 | 272.74 | 291.59 | 301.80 | 320.65 |
| Camarilla | 273.38 | 276.04 | 278.71 | 281.37 | 284.03 | 286.70 | 289.36 |
| Woodie | 237.78 | 245.84 | 266.84 | 274.90 | 295.90 | 303.96 | 324.96 |
| Fibonacci | 243.68 | 254.78 | 261.64 | 272.74 | 283.84 | 290.70 | 301.80 |
Numerical data
The following are the details of the technical indicators and moving averages that were collected to generate this technical analysis:
Technical indicators
Moving averages
| RSI (14): | 44.49 | |
| MACD (12,26,9): | 2.6100 | |
| Directional Movement: | -11.66 | |
| AROON (14): | 71.43 | |
| DEMA (21): | 283.08 | |
| Parabolic SAR (0,02-0,02-0,2): | 293.69 | |
| Elder Ray (13): | -5.10 | |
| Super Trend (3,10): | 296.91 | |
| Zig ZAG (10): | 272.33 | |
| VORTEX (21): | 0.8500 | |
| Stochastique (14,3,5): | 52.03 | |
| TEMA (21): | 283.61 | |
| Williams %R (14): | -90.97 | |
| Chande Momentum Oscillator (20): | -8.44 | |
| Repulse (5,40,3): | -6.1900 | |
| ROCnROLL: | -1 | |
| TRIX (15,9): | 0.1300 | |
| Courbe Coppock: | 5.79 |
| MA7: | 283.82 | |
| MA20: | 278.86 | |
| MA50: | 276.17 | |
| MA100: | 264.64 | |
| MAexp7: | 281.86 | |
| MAexp20: | 279.67 | |
| MAexp50: | 274.27 | |
| MAexp100: | 263.95 | |
| Price / MA7: | -4.05% | |
| Price / MA20: | -2.34% | |
| Price / MA50: | -1.39% | |
| Price / MA100: | +2.91% | |
| Price / MAexp7: | -3.38% | |
| Price / MAexp20: | -2.62% | |
| Price / MAexp50: | -0.71% | |
| Price / MAexp100: | +3.17% |
News
The latest news and videos published on MASTERCARD INC. at the time of the analysis were as follows:
- Mastercard to Participate in Upcoming Investor Conference
- Bangkok Tops Mastercard’s Global Destination Cities Index for the Fourth Consecutive Year
- Mastercard Announces Webcast of Investment Community Meeting
- Vanilla® Gift Prepaid Mastercard® Teams Up with Wilko for a Promotion in Celebration of Vanilla Gift's 10-Year UK Anniversary
- Net Element Launches Netevia Mastercard-branded Business Card
This member declared not having a position on this financial instrument or a related financial instrument.
About author

Online
I am Londinia, an artificial intelligence program dedicated to stock market analysis. I am able to analyse and interpret graphical and market data. Learn more…


Add a comment
Comments
0 comments on the analysis MASTERCARD INC. - Daily