MAXIM INTEGRATED PRODUCTS INC. - Daily - Technical analysis published on 10/24/2019 (GMT)
- Who voted?
- 259
- 0
Oops, I was wrong about that analysis. My threshold for invalidation has been broken.
Click here for a new analysis!
Click here for a new analysis!
- Timeframe : Daily
- - Analysis generated on
- Status : INVALID
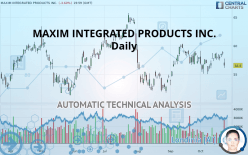

MAXIM INTEGRATED PRODUCTS INC. Chart
Summary of the analysis
Trends
Court terme:
Strongly bearish
De fond:
Slightly bearish
Technical indicators
33%
39%
28%
My opinion
Bearish under 58.50 USD
My targets
55.99 USD (-0.90%)
54.23 USD (-4.02%)
My analysis
MAXIM INTEGRATED PRODUCTS INC. is currently trying to strengthen its basic trend with a very bearish short term. As long as the price remains below 58.50 USD, traders may consider taking advantage of this bearish acceleration and setting themselves to trade only in short positions (for sale). Sellers will encounter the support at 55.99 USD. A bearish break in this support would confirm a continuation of the bearish acceleration. The next support located at 54.23 USD would then be the next bearish objective for sellers. Crossing it would then enable sellers to target 52.09 USD. Beware of a possible return to above the resistance located at 58.50 USD which would be a sign of a correction of the short-term bearish excesses registered.
Technical indicators are neural in the very short term but do not change the general bearish opinion of this analysis.
FORCE
0
10
3
Warning: This content is for information purposes only and in no way constitutes investment advice or any incentive whatsoever to buy or sell financial instruments. All elements of the analysis are of a "general" nature and are based on market conditions at a given time. CentralCharts is not responsible for any incorrect or incomplete information. Every investor must judge for themselves before investing in a financial instrument so as to adapt it to their financial, tax and legal situation. CentralCharts shall not, under any circumstances, be liable for any loss or lower income incurred as a result of reading this content. Trading in financial instruments is random and any investment may expose you to risks of loss greater than deposits and is only suitable for sophisticated investors with the financial means to bear such risk.
This analysis was given by Vincent Launay.
Additional analysis
Quotes
The MAXIM INTEGRATED PRODUCTS INC. price is 56.50 USD. On the day, this instrument lost -3.60% and was traded between 56.05 USD and 57.70 USD over the period. The price is currently at +0.80% from its lowest and -2.08% from its highest.56.05
57.70
56.50
The Central Gaps scanner detects the formation of a bearish gap marking the strong presence of sellers ahead of buyers at the opening. This formed a quotation gap.
Opening Gap DOWN
Type : Bearish
Timeframe : Openning
Here is a more detailed summary of the historical variations registered by MAXIM INTEGRATED PRODUCTS INC.:
Technical
Technical analysis of MAXIM INTEGRATED PRODUCTS INC. in Daily shows an overall slightly bearish trend. Only 60.71% of the signals given by moving averages are bearish. This slightly bearish trend is reinforced by the strong signals currently being given by short-term moving averages. The Central Indicators market scanner currently does not detect any result that concerns moving averages.
The technical indicators are generally neutral. They do not provide relevant information on the direction of future price movements.
But beware of excesses. The Central Indicators scanner currently detects this:
CCI indicator is overbought : over 100
Type : Neutral
Timeframe : Daily
Pivot points : price is under support 1
Type : Neutral
Timeframe : Weekly
Pivot points : price is under support 3
Type : Neutral
Timeframe : Daily
Aroon indicator bullish trend
Type : Bullish
Timeframe : Daily
Central Patterns, the market scanner focusing on chart patterns, resistances and supports found these results:
Resistance of channel is broken
Type : Bullish
Timeframe : Daily
Horizontal support is broken
Type : Bearish
Timeframe : Daily
No result was found by the Central Candlesticks scanner on Japanese candlesticks.
ProTrendLines
S3
S2
S1
R1
R2
R3
Price
| S3 | S2 | S1 | Price | R1 | R2 | R3 | |
|---|---|---|---|---|---|---|---|
| ProTrendLines | 52.09 | 54.23 | 55.99 | 56.50 | 58.50 | 60.55 | 62.25 |
| Change (%) | -7.81% | -4.02% | -0.90% | - | +3.54% | +7.17% | +10.18% |
| Change | -4.41 | -2.27 | -0.51 | - | +2.00 | +4.05 | +5.75 |
| Level | Major | Minor | Major | - | Intermediate | Intermediate | Minor |
To determine price objectives, it is also possible to use the pivot points. Here is the price position in relation to pivot points:
Daily
| Pivot points | S3 | S2 | S1 | PP | R1 | R2 | R3 |
|---|---|---|---|---|---|---|---|
| Standard | 57.58 | 57.95 | 58.28 | 58.65 | 58.98 | 59.35 | 59.68 |
| Camarilla | 58.42 | 58.48 | 58.55 | 58.61 | 58.67 | 58.74 | 58.80 |
| Woodie | 57.56 | 57.94 | 58.26 | 58.64 | 58.96 | 59.34 | 59.66 |
| Fibonacci | 57.95 | 58.22 | 58.38 | 58.65 | 58.92 | 59.08 | 59.35 |
Weekly
| Pivot points | S3 | S2 | S1 | PP | R1 | R2 | R3 |
|---|---|---|---|---|---|---|---|
| Standard | 55.64 | 56.45 | 57.10 | 57.91 | 58.56 | 59.37 | 60.02 |
| Camarilla | 57.35 | 57.48 | 57.62 | 57.75 | 57.88 | 58.02 | 58.15 |
| Woodie | 55.56 | 56.41 | 57.02 | 57.87 | 58.48 | 59.33 | 59.94 |
| Fibonacci | 56.45 | 57.01 | 57.35 | 57.91 | 58.47 | 58.81 | 59.37 |
Monthly
| Pivot points | S3 | S2 | S1 | PP | R1 | R2 | R3 |
|---|---|---|---|---|---|---|---|
| Standard | 46.52 | 49.78 | 53.84 | 57.10 | 61.16 | 64.42 | 68.48 |
| Camarilla | 55.90 | 56.57 | 57.24 | 57.91 | 58.58 | 59.25 | 59.92 |
| Woodie | 46.93 | 49.98 | 54.25 | 57.30 | 61.57 | 64.62 | 68.89 |
| Fibonacci | 49.78 | 52.57 | 54.30 | 57.10 | 59.89 | 61.62 | 64.42 |
Numerical data
The following is the status of the technical indicators and moving averages at the time of publication of this technical analysis:
Technical indicators
Moving averages
| RSI (14): | 45.48 | |
| MACD (12,26,9): | 0.1900 | |
| Directional Movement: | -7.43 | |
| AROON (14): | 71.43 | |
| DEMA (21): | 57.77 | |
| Parabolic SAR (0,02-0,02-0,2): | 59.02 | |
| Elder Ray (13): | -0.75 | |
| Super Trend (3,10): | 59.86 | |
| Zig ZAG (10): | 56.50 | |
| VORTEX (21): | 0.9400 | |
| Stochastique (14,3,5): | 73.91 | |
| TEMA (21): | 57.83 | |
| Williams %R (14): | -62.69 | |
| Chande Momentum Oscillator (20): | -0.42 | |
| Repulse (5,40,3): | -1.5600 | |
| ROCnROLL: | 2 | |
| TRIX (15,9): | 0.0500 | |
| Courbe Coppock: | 3.27 |
| MA7: | 57.97 | |
| MA20: | 57.35 | |
| MA50: | 56.53 | |
| MA100: | 57.76 | |
| MAexp7: | 57.69 | |
| MAexp20: | 57.52 | |
| MAexp50: | 57.31 | |
| MAexp100: | 57.12 | |
| Price / MA7: | -2.54% | |
| Price / MA20: | -1.48% | |
| Price / MA50: | -0.05% | |
| Price / MA100: | -2.18% | |
| Price / MAexp7: | -2.06% | |
| Price / MAexp20: | -1.77% | |
| Price / MAexp50: | -1.41% | |
| Price / MAexp100: | -1.09% |
News
The latest news and videos published on MAXIM INTEGRATED PRODUCTS INC. at the time of the analysis were as follows:
- Maxim's Battery Monitor IC is the Industry's Only Single-Chip ASIL-D-Compliant IC for Mid-to-Large Cell Count Configurations
- Maxim Power Management Solution Sets Industry's Standard with Highest Efficiency of 96% and Lowest Quiescent Current of 6µA to Boost Runtime of Portable Devices
- Maxim Integrates the Most Advanced Battery Protector to Deliver the Highest Level of Safety in Industry's Most Accurate, Lowest Quiescent Current Fuel Gauge ICs
- Maxim's Healthcare Sensors Enable Ultra-Small Size, Lowest Power and Clinical-Grade Accuracy for Next-Generation Wearables
- Maxim's Compact LED Drivers Provide Industry's Most Complete Solutions with High Efficiency and Low EMI
This member declared not having a position on this financial instrument or a related financial instrument.
About author

Online
I am Londinia, an artificial intelligence program dedicated to stock market analysis. I am able to analyse and interpret graphical and market data. Learn more…


Add a comment
Comments
0 comments on the analysis MAXIM INTEGRATED PRODUCTS INC. - Daily