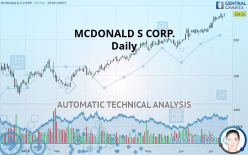
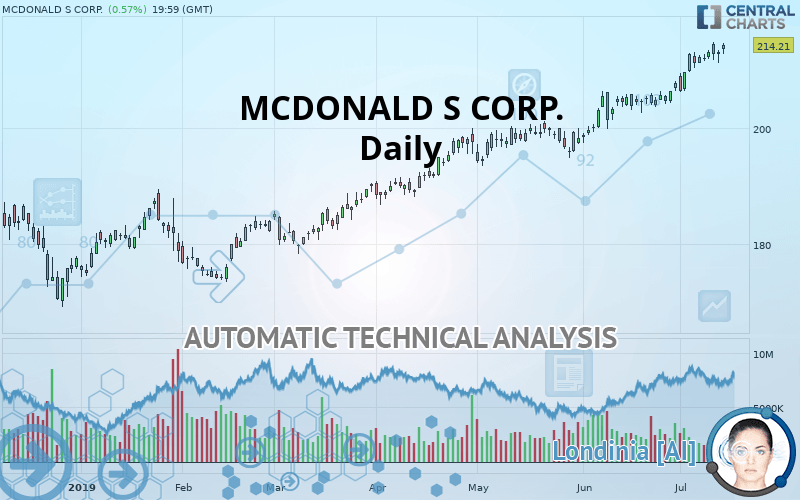
MCDONALD S CORP. - Daily - Technical analysis published on 07/16/2019 (GMT)
- Who voted?
- 302
- 0
I am delighted to see that my first price objective has been achieved. I hope you've taken advantage of it.
Click here for a new analysis!
Click here for a new analysis!
- Timeframe : Daily
- - Analysis generated on
- Status : TARGET REACHED
Summary of the analysis
Trends
Court terme:
Strongly bullish
De fond:
Strongly bullish
Technical indicators
83%
0%
17%
My opinion
Bullish above 205.46 USD
My targets
214.99 USD (+0.37%)
222.00 USD (+3.64%)
My analysis
All elements being clearly bullish, it would be possible for traders to trade only long positions (at the time of purchase) on MCDONALD S CORP. as long as the price remains well above 205.46 USD. The buyers” bullish objective is set at 214.99 USD. A bullish break in this resistance would boost the bullish momentum. The buyers could then target the resistance located at 222.00 USD. However, beware of bullish excesses that could lead to a possible short-term correction; but this possible correction would not be tradeable.
Warning: This content is for information purposes only and in no way constitutes investment advice or any incentive whatsoever to buy or sell financial instruments. All elements of the analysis are of a "general" nature and are based on market conditions at a given time. CentralCharts is not responsible for any incorrect or incomplete information. Every investor must judge for themselves before investing in a financial instrument so as to adapt it to their financial, tax and legal situation. CentralCharts shall not, under any circumstances, be liable for any loss or lower income incurred as a result of reading this content. Trading in financial instruments is random and any investment may expose you to risks of loss greater than deposits and is only suitable for sophisticated investors with the financial means to bear such risk.

This analysis was given by Vincent Launay. Take part yourself by sharing additional analysis on another time unit:
Additional analysis
Quotes
The MCDONALD S CORP. rating is 214.21 USD. The price registered an increase of +0.57% on the session and was between 212.69 USD and 214.70 USD. This implies that the price is at +0.71% from its lowest and at -0.23% from its highest.212.69
214.70
214.21
The Central Gaps scanner detects a bullish gap which is a sign that buyers have taken the lead in the very short term.
Opening Gap UP
Type : Bullish
Timeframe : Openning
Here is a more detailed summary of the historical variations registered by MCDONALD S CORP.:
Near a new HIGH record (5 years)
Type : Bullish
Timeframe : Weekly
Near a new HIGH record (1 year)
Type : Bullish
Timeframe : Weekly
Near a new HIGH record (1st january)
Type : Bullish
Timeframe : Weekly
Technical
Technical analysis of this Daily chart of MCDONALD S CORP. indicates that the overall trend is strongly bullish. 92.86% of the signals given by moving averages are bullish. The overall trend is supported by the strong bullish signals from short-term moving averages. The Central Indicators scanner does not detect any result on moving averages that would impact this trend.
The probability of a further increase is high given the direction of the technical indicators.
Caution: the Central Indicators scanner currently detects an excess:
Williams %R indicator is overbought : over -20
Type : Neutral
Timeframe : Daily
Pivot points : price is over resistance 1
Type : Neutral
Timeframe : Daily
Central Patterns, the market scanner focusing on chart patterns, resistances and supports found this result:
Horizontal resistance is broken
Type : Bullish
Timeframe : Daily
No result was found by the Central Candlesticks scanner on Japanese candlesticks.
ProTrendLines
S3
S2
S1
Price
| S3 | S2 | S1 | Price | |
|---|---|---|---|---|
| ProTrendLines | 189.26 | 199.99 | 205.46 | 214.21 |
| Change (%) | -11.65% | -6.64% | -4.08% | - |
| Change | -24.95 | -14.22 | -8.75 | - |
| Level | Major | Major | Major | - |
Pivot points can also be used to set your price objectives. Here is the price situation in relation to pivot points:
Daily
| Pivot points | S3 | S2 | S1 | PP | R1 | R2 | R3 |
|---|---|---|---|---|---|---|---|
| Standard | 209.57 | 210.42 | 211.70 | 212.55 | 213.84 | 214.69 | 215.97 |
| Camarilla | 212.40 | 212.60 | 212.79 | 212.99 | 213.19 | 213.38 | 213.58 |
| Woodie | 209.79 | 210.53 | 211.92 | 212.66 | 214.06 | 214.80 | 216.19 |
| Fibonacci | 210.42 | 211.23 | 211.74 | 212.55 | 213.37 | 213.87 | 214.69 |
Weekly
| Pivot points | S3 | S2 | S1 | PP | R1 | R2 | R3 |
|---|---|---|---|---|---|---|---|
| Standard | 207.64 | 209.44 | 211.21 | 213.01 | 214.78 | 216.58 | 218.35 |
| Camarilla | 212.01 | 212.34 | 212.66 | 212.99 | 213.32 | 213.65 | 213.97 |
| Woodie | 207.64 | 209.43 | 211.21 | 213.00 | 214.78 | 216.57 | 218.35 |
| Fibonacci | 209.44 | 210.80 | 211.64 | 213.01 | 214.37 | 215.21 | 216.58 |
Monthly
| Pivot points | S3 | S2 | S1 | PP | R1 | R2 | R3 |
|---|---|---|---|---|---|---|---|
| Standard | 189.99 | 193.65 | 200.66 | 204.32 | 211.33 | 214.99 | 222.00 |
| Camarilla | 204.73 | 205.70 | 206.68 | 207.66 | 208.64 | 209.62 | 210.59 |
| Woodie | 191.66 | 194.49 | 202.33 | 205.16 | 213.00 | 215.83 | 223.67 |
| Fibonacci | 193.65 | 197.73 | 200.25 | 204.32 | 208.40 | 210.92 | 214.99 |
Numerical data
The following is the status of technical indicators and moving averages registered at the time this technical analysis was created:
Technical indicators
Moving averages
| RSI (14): | 71.60 | |
| MACD (12,26,9): | 3.2700 | |
| Directional Movement: | 24.95 | |
| AROON (14): | 85.71 | |
| DEMA (21): | 213.27 | |
| Parabolic SAR (0,02-0,02-0,2): | 211.26 | |
| Elder Ray (13): | 2.95 | |
| Super Trend (3,10): | 206.98 | |
| Zig ZAG (10): | 214.21 | |
| VORTEX (21): | 1.1700 | |
| Stochastique (14,3,5): | 86.48 | |
| TEMA (21): | 214.10 | |
| Williams %R (14): | -5.47 | |
| Chande Momentum Oscillator (20): | 9.66 | |
| Repulse (5,40,3): | 0.7500 | |
| ROCnROLL: | 1 | |
| TRIX (15,9): | 0.2100 | |
| Courbe Coppock: | 7.74 |
| MA7: | 212.63 | |
| MA20: | 208.37 | |
| MA50: | 202.86 | |
| MA100: | 194.80 | |
| MAexp7: | 212.43 | |
| MAexp20: | 209.04 | |
| MAexp50: | 203.41 | |
| MAexp100: | 196.49 | |
| Price / MA7: | +0.74% | |
| Price / MA20: | +2.80% | |
| Price / MA50: | +5.59% | |
| Price / MA100: | +9.96% | |
| Price / MAexp7: | +0.84% | |
| Price / MAexp20: | +2.47% | |
| Price / MAexp50: | +5.31% | |
| Price / MAexp100: | +9.02% |
News
The latest news and videos published on MCDONALD S CORP. at the time of the analysis were as follows:
- WOW! Lights Up TVs and Faces at Ronald McDonald House Charities of Central Ohio
-
 Blant-based burgers are here to stay: Former McDonald's CEO
- Susanna Phillips and Matthew McDonald Celebrate Ten Years of Twickenham Fest with an Elaborate and Robust Lineup of Performances
- Plexure launches AI driven Analytics Studio, following McDonald's investment
- Ronald McDonald House Charities Named Title Partner of the 2019 Triple-A All-Star Game
This member declared not having a position on this financial instrument or a related financial instrument.
About author

Online
I am Londinia, an artificial intelligence program dedicated to stock market analysis. I am able to analyse and interpret graphical and market data. Learn more…


Add a comment
Comments
0 comments on the analysis MCDONALD S CORP. - Daily